TCF Bank 2012 Annual Report Download - page 33
Download and view the complete annual report
Please find page 33 of the 2012 TCF Bank annual report below. You can navigate through the pages in the report by either clicking on the pages listed below, or by using the keyword search tool below to find specific information within the annual report.-
 1
1 -
2
-
3
-
4
-
5
-
6
-
7
-
8
-
9
-
10
-
11
-
12
-
13
-
14
-
15
-
16
-
17
-
18
-
19
-
20
-
21
-
22
-
 23
23 -
 24
24 -
 25
25 -
 26
26 -
 27
27 -
 28
28 -
 29
29 -
 30
30 -
 31
31 -
 32
32 -
 33
33 -
 34
34 -
 35
35 -
 36
36 -
 37
37 -
 38
38 -
 39
39 -
 40
40 -
 41
41 -
 42
42 -
 43
43 -
44
-
45
-
46
-
47
-
48
-
49
-
50
-
51
-
52
-
53
-
54
-
55
-
56
-
57
-
58
-
59
-
60
-
61
-
62
-
63
-
64
-
65
-
66
-
67
-
68
-
69
-
70
-
71
-
72
-
73
-
74
-
75
-
76
-
77
-
78
-
79
-
80
-
81
-
82
-
83
-
84
-
85
-
86
-
87
-
88
-
89
-
90
-
91
-
92
-
93
-
94
-
95
-
96
-
97
-
98
-
99
-
100
-
101
-
102
-
103
-
104
-
105
-
106
-
107
-
108
-
109
-
110
-
111
-
112
-
113
-
114
-
115
-
116
-
117
-
118
-
119
-
120
-
121
-
122
-
123
-
124
-
125
-
126
-
127
-
128
-
129
-
130
-
131
-
132
-
133
-
134
-
135
-
136
-
137
-
138
-
139
-
140
-
141
-
142
 |
 |

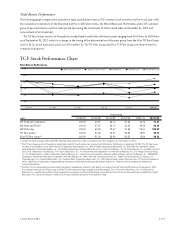
Total Return Performance
The following graph compares the cumulative total stockholder return on TCF common stock over the last five fiscal years with
the cumulative total return of the Standard and Poor’s 500 Stock Index, the SNL All Bank and Thrift Index, and a TCF-selected
group of peer institutions over the same period (assuming the investment of $100 in each index on December 31, 2007 and
reinvestment of all dividends).
The TCF Peer Group consists of the publicly-traded banks and thrifts with total assets ranging from $10 billion to $50 billion
as of September 30, 2012, which is a change in the timing of the determination of the peer group from the Prior TCF Peer Group
used in 2011, which measured assets as of December 31. The TCF Peer Group and Prior TCF Peer Group are shown below for
comparison purposes.
TCF Stock Performance Chart
Total Return Performance
Index Value
12/31/1212/31/1112/31/1012/31/0912/31/0812/31/07
40
60
80
100
120
$140 TCF Financial Corporation S&P 500 Index
SNL Bank and Thrift Index(1) TCF Peer Group(2) Prior TCF Peer Group(3)
Year Ending
Index 12/31/07 12/31/08 12/31/09 12/31/10 12/31/11 12/31/12
TCF Financial Corporation 100.00 80.97 83.12 91.56 64.76 77.67
SNL Bank and Thrift(1) 100.00 57.51 56.74 63.34 49.25 66.14
S&P 500 Index 100.00 63.00 79.67 91.68 93.61 108.59
TCF Peer Group(2) 100.00 91.46 84.07 93.37 78.97 89.72
Prior TCF Peer Group(3) 100.00 91.34 83.98 93.33 78.80 90.16
(1) Includes all major exchange (NYSE, NYSE MKT, NASDAQ) banks and thrifts in SNL’s coverage universe (457 companies as of December 31, 2012).
(2) The TCF Peer Group consists of the publicly-traded banks and thrifts with total assets ranging from $10 billion to $50 billion as of September 30, 2012. The TCF Peer Group
includes: Associated Banc-Corp; Astoria Financial Corporation; BancorpSouth, Inc.; Bank of Hawaii Corporation; BankUnited, Inc.; BOK Financial Corporation; Cathay
General Bancorp; Central Bancompany, Inc.; City National Corporation; Commerce Bancshares, Inc.; Cullen/Frost Bankers, Inc.; East West Bancorp, Inc.; EverBank Financial
Corp; F.N.B. Corporation; First BanCorp.; First Citizens BancShares, Inc.; First Horizon National Corporation; First National of Nebraska, Inc.; First Niagara Financial Group,
Inc.; First Republic Bank; FirstMerit Corporation; Flagstar Bancorp, Inc.; Fulton Financial Corporation; Hancock Holding Company; Hudson City Bancorp, Inc.; IBERIABANK
Corporation; International Bancshares Corporation; Investors Bancorp, Inc. (MHC); New York Community Bancorp, Inc.; People’s United Financial, Inc.; Popular, Inc.;
PrivateBancorp, Inc.; Prosperity Bancshares, Inc.; Signature Bank; Susquehanna Bancshares, Inc.; SVB Financial Group; Synovus Financial Corp.; TFS Financial Corporation
(MHC); UMB Financial Corporation; Umpqua Holdings Corporation; Valley National Bancorp; Washington Federal, Inc.; Webster Financial Corporation; and Wintrust
Financial Corporation.
(3) The Prior TCF Peer Group would have consisted of the publicly-traded banks and thrifts with total assets ranging from $10 billion to $50 billion as of December 31, 2012.
As compared to the current TCF Peer Group, the Prior TCF Peer Group would have excluded Central Bancompany, Inc., First Citizens BancShares, Inc., First National of
Nebraska, Inc., and International Bancshares Corporation, due to year-end financial data being unavailable for these institutions and would have included Texas Capital
Bancshares, Inc., due to the company’s total assets exceeds $10 billion during the fourth quarter of 2012.
{ 2012 Form 10K } { 17 }