TCF Bank 2012 Annual Report Download - page 44
Download and view the complete annual report
Please find page 44 of the 2012 TCF Bank annual report below. You can navigate through the pages in the report by either clicking on the pages listed below, or by using the keyword search tool below to find specific information within the annual report.-
 1
1 -
2
-
3
-
4
-
5
-
6
-
7
-
8
-
9
-
10
-
11
-
12
-
13
-
14
-
15
-
16
-
17
-
18
-
19
-
20
-
21
-
22
-
23
-
24
-
25
-
26
-
27
-
28
-
29
-
30
-
31
-
32
-
33
-
 34
34 -
 35
35 -
 36
36 -
 37
37 -
 38
38 -
 39
39 -
 40
40 -
 41
41 -
 42
42 -
 43
43 -
 44
44 -
 45
45 -
 46
46 -
 47
47 -
 48
48 -
 49
49 -
 50
50 -
 51
51 -
 52
52 -
 53
53 -
 54
54 -
55
-
56
-
57
-
58
-
59
-
60
-
61
-
62
-
63
-
64
-
65
-
66
-
67
-
68
-
69
-
70
-
71
-
72
-
73
-
74
-
75
-
76
-
77
-
78
-
79
-
80
-
81
-
82
-
83
-
84
-
85
-
86
-
87
-
88
-
89
-
90
-
91
-
92
-
93
-
94
-
95
-
96
-
97
-
98
-
99
-
100
-
101
-
102
-
103
-
104
-
105
-
106
-
107
-
108
-
109
-
110
-
111
-
112
-
113
-
114
-
115
-
116
-
117
-
118
-
119
-
120
-
121
-
122
-
123
-
124
-
125
-
126
-
127
-
128
-
129
-
130
-
131
-
132
-
133
-
134
-
135
-
136
-
137
-
138
-
139
-
140
-
141
-
142
 |
 |

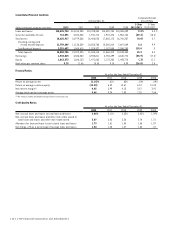
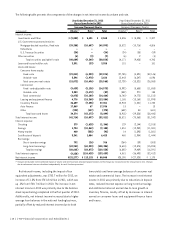
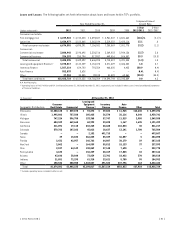
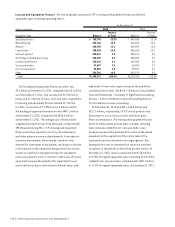
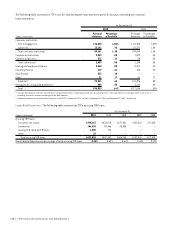
Non-Interest Income Non-interest income is a significant source of revenue for TCF, representing 38.6% of total revenues
in 2012, 38.8% in 2011 and 43.5% in 2010, and is an important factor in TCF’s results of operations. Total fees and other
revenue were $388.2 million for 2012, compared with $437.2 million in 2011 and $508.9 million in 2010. The following table
summarizes the components of non-interest income.
Year Ended December 31, Growth Rate
(Dollars in thousands) 2012 2011 2010 2009 2008
1–Year
2012/2011
5–Year
2012/2007
Fees and service charges $177,953 $219,363 $273,181 $286,908 $270,739 (18.9)% (8.5)%
Card revenue 52,638 96,147 111,067 104,770 103,082 (45.3) (11.8)
ATM revenue 24,181 27,927 29,836 30,438 32,645 (13.4) (7.5)
Subtotal 254,772 343,437 414,084 422,116 406,466 (25.8) (9.2)
Leasing and equipment finance 92,721 89,167 89,194 69,113 55,488 4.0 9.4
Gains on sales of auto loans 22,101 1,133 – – – N.M. N.M.
Gains on sales of consumer
real estate loans 5,413 – – – – N.M. N.M.
Other 13,184 3,434 5,584 5,239 12,107 N.M. (6.6)
Fees and other revenue 388,191 437,171 508,862 496,468 474,061 (11.2) (4.6)
Gains on securities, net 102,232 7,263 29,123 29,387 16,066 N.M. 50.4
Visa share redemption –– – – 8,308 N.M. N.M.
Total non-interest income $490,423 $444,434 $537,985 $525,855 $498,435 10.3 (2.0)
Fees and other revenue as a
percentage of total revenue 30.6% 38.2% 41.1% 42.8% 43.4%
N.M. Not Meaningful.
Fees and Service Charges Banking and service fees
decreased $41.4 million, or 18.9%, to $178 million for
2012, compared with $219.4 million for 2011 and $273.2
million for 2010. The decrease in 2012 was primarily due to
the elimination of the monthly maintenance fee with the
introduction of TCF Free Checking in the second quarter
of 2012 and a lower number of accounts. The decrease in
2011 compared with 2010 was primarily due to changes
in customer behavior and increased levels of checking
account attrition.
Card Revenue During 2012, card revenue, primarily
interchange fees, totaled $52.6 million, down from
$96.1 million in 2011 and $111.1 million in 2010. The
decreases in 2012 and 2011 were primarily due to a
decrease in the average interchange rate per transaction
as a result of the Durbin Amendment, which took effect
during the fourth quarter of 2011 resulting in a decrease
in card revenue of $43.2 million and $14.7 million in 2012
and 2011, respectively.
TCF is the 15th largest issuer of Visa® consumer debit
cards and the 12th largest issuer of Visa small business debit
cards in the United States, based on payment volume for
the three months ended September 30, 2012, as provided
by Visa. TCF earns interchange revenue from customer card
transactions paid primarily by merchants, not from TCF’s
customers. Card revenue represented 20.7% and 28% of
banking fee revenue for the years ended December 31, 2012
and December 31, 2011, respectively. Visa has significant
litigation against it regarding interchange pricing and there
is a risk this revenue could be impacted by any settlement
or adverse rulings in such litigation. The continued success
of TCF’s debit card program depends significantly on the
success and viability of Visa and the continued use by
customers and acceptance by merchants of its cards.
Gains on Sales of Auto Loans TCF sold $536.7 million
and $37.4 million of auto loans and recognized $22.1
million and $1.1 million in associated gains during 2012
and 2011, respectively. The increase was primarily due to
the full year impact of the acquisition and ramp-up of the
recently acquired auto finance business.
Gains on Sales of Consumer Real Estate Loans
In 2012, TCF sold $161.8 million of consumer real estate
loans and received proceeds of $167.2 million and recognized
gains of $5.4 million.
{ 28 } { TCF Financial Corporation and Subsidiaries }