TCF Bank 2012 Annual Report Download - page 36
Download and view the complete annual report
Please find page 36 of the 2012 TCF Bank annual report below. You can navigate through the pages in the report by either clicking on the pages listed below, or by using the keyword search tool below to find specific information within the annual report.-
 1
1 -
2
-
3
-
4
-
5
-
6
-
7
-
8
-
9
-
10
-
11
-
12
-
13
-
14
-
15
-
16
-
17
-
18
-
19
-
20
-
21
-
22
-
23
-
24
-
25
-
 26
26 -
 27
27 -
 28
28 -
 29
29 -
 30
30 -
 31
31 -
 32
32 -
 33
33 -
 34
34 -
 35
35 -
 36
36 -
 37
37 -
 38
38 -
 39
39 -
 40
40 -
 41
41 -
 42
42 -
 43
43 -
 44
44 -
 45
45 -
 46
46 -
47
-
48
-
49
-
50
-
51
-
52
-
53
-
54
-
55
-
56
-
57
-
58
-
59
-
60
-
61
-
62
-
63
-
64
-
65
-
66
-
67
-
68
-
69
-
70
-
71
-
72
-
73
-
74
-
75
-
76
-
77
-
78
-
79
-
80
-
81
-
82
-
83
-
84
-
85
-
86
-
87
-
88
-
89
-
90
-
91
-
92
-
93
-
94
-
95
-
96
-
97
-
98
-
99
-
100
-
101
-
102
-
103
-
104
-
105
-
106
-
107
-
108
-
109
-
110
-
111
-
112
-
113
-
114
-
115
-
116
-
117
-
118
-
119
-
120
-
121
-
122
-
123
-
124
-
125
-
126
-
127
-
128
-
129
-
130
-
131
-
132
-
133
-
134
-
135
-
136
-
137
-
138
-
139
-
140
-
141
-
142
 |
 |

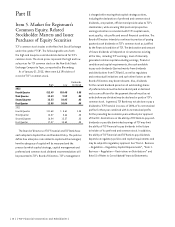
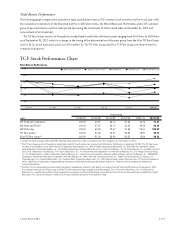
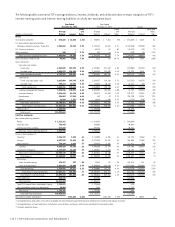
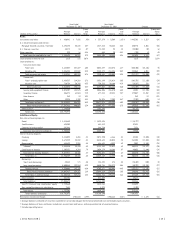
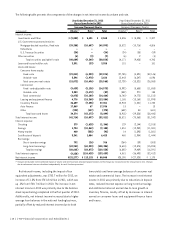
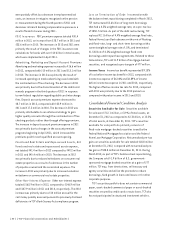
Consolidated Financial Condition:
At December 31,
Compound Annual
Growth Rate
(Dollars in thousands, except per-share data) 2012 2011 2010 2009 2008
1-Year
2012/2011
5-Year
2012/2007
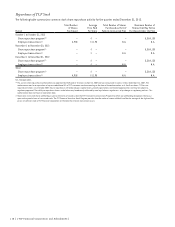
Loans and leases $15,425,724 $14,150,255 $14,788,304 $14,590,744 $13,345,889 9.0% 4.3 %
Securities available for sale 712,091 2,324,038 1,931,174 1,910,476 1,966,104 (69.4) (18.4)
Total assets 18,225,917 18,979,388 18,465,025 17,885,175 16,740,357 (4.0) 2.7
Checking, savings and
money market deposits 11,759,289 11,136,389 10,556,788 10,380,814 7,647,069 5.6 9.9
Certificates of deposit 2,291,497 1,065,615 1,028,327 1,187,505 2,596,283 115.0 .3
Total deposits 14,050,786 12,202,004 11,585,115 11,568,319 10,243,352 15.2 8.0
Borrowings 1,933,815 4,388,080 4,985,611 4,755,499 4,660,774 (55.9) (17.2)
Equity 1,863,373 1,868,133 1,471,663 1,175,362 1,493,776 (.3) 11.1
Book value per common share 9.79 11.65 10.30 9.10 8.99 (16.0) 2.4
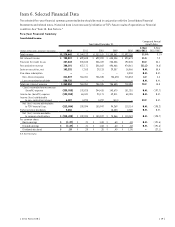
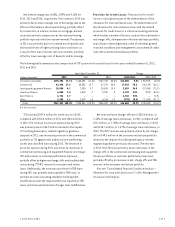
Financial Ratios:
At or For the Year Ended December 31,
2012 2011 2010 2009 2008
Return on average assets (1.14)% .61% .85% .54% .69%
Return on average common equity (13.33) 6.32 10.67 6.57 10.03
Net interest margin(1) 4.65 3.99 4.15 3.87 3.91
Average total equity to average assets 9.66 9.24 7.83 7.20 7.04
(1) Net interest income divided by average interest-earning assets
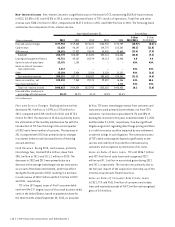
Credit Quality Ratios:
At or For the Year Ended December 31,
2012 2011 2010 2009 2008
Non-accrual loans and leases to total loans and leases 2.46% 2.11% 2.33% 2.03% 1.29%
Non-accrual loans and leases and other real estate owned to
total loans and leases and other real estate owned 3.07 3.03 3.26 2.74 1.75
Allowance for loan and lease losses to total loans and leases 1.73 1.81 1.80 1.68 1.29
Net charge-offs as a percentage of average loans and leases 1.54 1.45 1.47 1.34 .78
{ 20 } { TCF Financial Corporation and Subsidiaries }