TCF Bank 2012 Annual Report Download - page 54
Download and view the complete annual report
Please find page 54 of the 2012 TCF Bank annual report below. You can navigate through the pages in the report by either clicking on the pages listed below, or by using the keyword search tool below to find specific information within the annual report.-
 1
1 -
2
-
3
-
4
-
5
-
6
-
7
-
8
-
9
-
10
-
11
-
12
-
13
-
14
-
15
-
16
-
17
-
18
-
19
-
20
-
21
-
22
-
23
-
24
-
25
-
26
-
27
-
28
-
29
-
30
-
31
-
32
-
33
-
34
-
35
-
36
-
37
-
38
-
39
-
40
-
41
-
42
-
43
-
 44
44 -
 45
45 -
 46
46 -
 47
47 -
 48
48 -
 49
49 -
 50
50 -
 51
51 -
 52
52 -
 53
53 -
 54
54 -
 55
55 -
 56
56 -
 57
57 -
 58
58 -
 59
59 -
 60
60 -
 61
61 -
 62
62 -
 63
63 -
 64
64 -
65
-
66
-
67
-
68
-
69
-
70
-
71
-
72
-
73
-
74
-
75
-
76
-
77
-
78
-
79
-
80
-
81
-
82
-
83
-
84
-
85
-
86
-
87
-
88
-
89
-
90
-
91
-
92
-
93
-
94
-
95
-
96
-
97
-
98
-
99
-
100
-
101
-
102
-
103
-
104
-
105
-
106
-
107
-
108
-
109
-
110
-
111
-
112
-
113
-
114
-
115
-
116
-
117
-
118
-
119
-
120
-
121
-
122
-
123
-
124
-
125
-
126
-
127
-
128
-
129
-
130
-
131
-
132
-
133
-
134
-
135
-
136
-
137
-
138
-
139
-
140
-
141
-
142
 |
 |

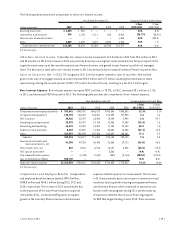
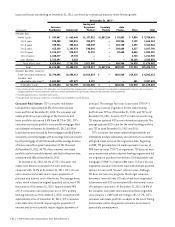
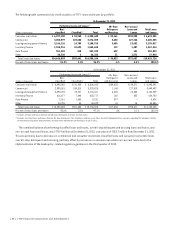
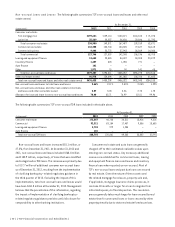
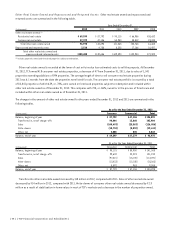
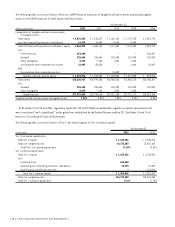
The following table summarizes TCF’s over 60-day delinquent loan and lease portfolio by type, excluding non-accrual
loans and leases.
At December 31,
2012 2011
Principal
Balances
Percentage
of Portfolio
Principal
Balances
Percentage
of Portfolio(Dollars in thousands)
Consumer real estate:
First mortgage lien $76,020 1.88% $ 87,358 1.89%
Junior lien 13,141 .55 22,277 1.04
Total consumer real estate 89,161 1.38 109,635 1.63
Commercial real estate 2,259 .08 1,099 .04
Commercial business 371 .12 49 .02
Total commercial 2,630 .08 1,148 .03
Leasing and equipment finance 2,568 .08 3,512 .13
Inventory finance 119 .01 160 .03
Auto finance 532 .10 – –
Other 31 .12 41 .12
Subtotal(1) 95,041 .64 114,496 .85
Delinquencies in acquired portfolios(2) 982 .58 3,140 .84
Total $96,023 .64% $117,636 .85%
(1) Excludes delinquencies and non-accrual loans in acquired portfolios, as delinquency and non-accrual migration in these portfolios are not expected to result in losses
exceeding the credit reserves netted against the loan balances.
(2) Remaining balances of acquired loans and leases were $170.7 million and $371.9 million at December 31, 2012 and December 31, 2011, respectively.
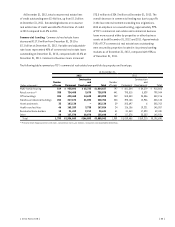
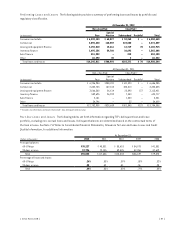
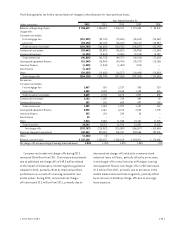
Loan Modifications The following table summarizes TCF’s accruing TDR loans.
At December 31,
(Dollars in thousands) 2012 2011 2010 2009 2008
Accruing TDR loans:
Consumer real estate $478,262 $433,078 $337,401 $252,510 $27,423
Commercial 144,508 98,448 48,838 – –
Leasing and equipment finance 1,050 776 – – –
Other 38 – – – –
Total accruing TDR loans $623,858 $532,302 $386,239 $252,510 $27,423
Over 60 day delinquency as a percentage of total accruing TDR loans 4.34% 5.69% 4.64% 2.48% 9.72%
{ 38 } { TCF Financial Corporation and Subsidiaries }