TCF Bank 2012 Annual Report Download - page 107
Download and view the complete annual report
Please find page 107 of the 2012 TCF Bank annual report below. You can navigate through the pages in the report by either clicking on the pages listed below, or by using the keyword search tool below to find specific information within the annual report.-
 1
1 -
2
-
3
-
4
-
5
-
6
-
7
-
8
-
9
-
10
-
11
-
12
-
13
-
14
-
15
-
16
-
17
-
18
-
19
-
20
-
21
-
22
-
23
-
24
-
25
-
26
-
27
-
28
-
29
-
30
-
31
-
32
-
33
-
34
-
35
-
36
-
37
-
38
-
39
-
40
-
41
-
42
-
43
-
44
-
45
-
46
-
47
-
48
-
49
-
50
-
51
-
52
-
53
-
54
-
55
-
56
-
57
-
58
-
59
-
60
-
61
-
62
-
63
-
64
-
65
-
66
-
67
-
68
-
69
-
70
-
71
-
72
-
73
-
74
-
75
-
76
-
77
-
78
-
79
-
80
-
81
-
82
-
83
-
84
-
85
-
86
-
87
-
88
-
89
-
90
-
91
-
92
-
93
-
94
-
95
-
96
-
 97
97 -
 98
98 -
 99
99 -
 100
100 -
 101
101 -
 102
102 -
 103
103 -
 104
104 -
 105
105 -
 106
106 -
 107
107 -
 108
108 -
 109
109 -
 110
110 -
 111
111 -
 112
112 -
 113
113 -
 114
114 -
 115
115 -
 116
116 -
 117
117 -
118
-
119
-
120
-
121
-
122
-
123
-
124
-
125
-
126
-
127
-
128
-
129
-
130
-
131
-
132
-
133
-
134
-
135
-
136
-
137
-
138
-
139
-
140
-
141
-
142
 |
 |

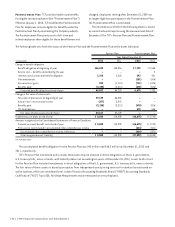
The following table sets forth the changes recognized in accumulated other comprehensive (income) loss that are attributed
to the Postretirement Plan at the dates indicated.
Postretirement Plan
Year Ended December 31,
(In thousands) 2012 2011 2010
Accumulated other comprehensive (income) loss at the beginning of the year $(301) $ 7 $11
Prior service cost (151) (301) –
Adjustment to transition obligation – (3) –
Amortizations (recognized in net periodic benefit cost):
Prior service credit 28 – –
Transition obligation – (4) (4)
Total recognized in other comprehensive income (123) (308) (4)
Accumulated other comprehensive (income) loss at end of year, before tax $(424) $(301) $ 7
The Pension Plan does not have any accumulated other comprehensive (income) loss.
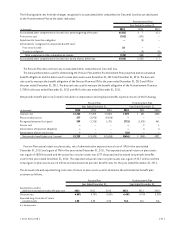
The measurement dates used for determining the Pension Plan and the Postretirement Plan projected and accumulated
benefit obligations and the dates used to value plan assets were December 31, 2012 and December 31, 2011. The discount
rate used to measure the benefit obligation of the Pension Plan was 3% for the year ended December 31, 2012 and 4% for
the year ended December 31, 2011. The discount rate used to measure the benefit obligation of the Postretirement Plan was
2.75% for the year ended December 31, 2012 and 4% for the year ended December 31, 2011.
Net periodic benefit plan cost (income) included in compensation and employee benefits expense consists of the following.
Pension Plan Postretirement Plan
Year Ended December 31, Year Ended December 31,
(In thousands) 2012 2011 2010 2012 2011 2010
Interest cost $1,763 $ 2,223 $ 2,554 $ 293 $ 431 $455
Return on plan assets 277 (3,975) (9,938) – – –
Recognized actuarial loss (gain) 289 (1,718) 1,726 (721) (1,426) 461
Service cost – – – – 2 1
Amortization of transition obligation – – – – 4 4
Amortization of prior service cost – – – (28) – –
Net periodic benefit plan cost (income) $2,329 $(3,470) $(5,658) $(456) $ (989) $921
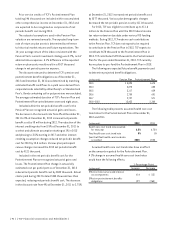
Pension Plan actual return on plan assets, net of administrative expenses was a loss of .5% for the year ended
December 31, 2012 and a gain of 7% for the year ended December 31, 2011. The expected actuarial return on plan assets
was a gain of $825 thousand and the actual loss on plan assets was $277 thousand and increased net periodic benefits
cost for the year ended December 31, 2012. The expected actuarial return on plan assets was a gain of $2.7 million and the
actual gain on plan assets was $4 million and decreased net periodic benefit costs for the year ended December 31, 2011.
The discount rate and expected long-term rate of return on plan assets used to determine the estimated net benefit plan
cost were as follows.
Pension Plan Postretirement Plan
Year Ended December 31, Year Ended December 31,
Assumptions used to
determine estimated net benefit plan cost 2012 2011 2010 2012 2011 2010
Discount rate 4.00% 4.75% 5.50% 4.00% 4.75% 5.25%
Expected long-term rate of return
on plan assets 1.50 5.00 8.50 N.A. N.A. N.A.
N.A. Not Applicable.
{ 2012 Form 10K } { 91 }