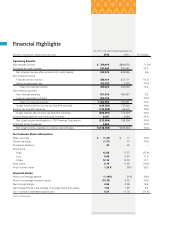
TCF Bank 2012 Annual Report Download - page 6
Download and view the complete annual report
Please find page 6 of the 2012 TCF Bank annual report below. You can navigate through the pages in the report by either clicking on the pages listed below, or by using the keyword search tool below to find specific information within the annual report.-
 1
1 -
 2
2 -
 3
3 -
 4
4 -
 5
5 -
 6
6 -
 7
7 -
 8
8 -
 9
9 -
 10
10 -
 11
11 -
 12
12 -
 13
13 -
 14
14 -
 15
15 -
 16
16 -
 17
17 -
18
-
19
-
20
-
21
-
22
-
23
-
24
-
25
-
26
-
27
-
28
-
29
-
30
-
31
-
32
-
33
-
34
-
35
-
36
-
37
-
38
-
39
-
40
-
41
-
42
-
43
-
44
-
45
-
46
-
47
-
48
-
49
-
50
-
51
-
52
-
53
-
54
-
55
-
56
-
57
-
58
-
59
-
60
-
61
-
62
-
63
-
64
-
65
-
66
-
67
-
68
-
69
-
70
-
71
-
72
-
73
-
74
-
75
-
76
-
77
-
78
-
79
-
80
-
81
-
82
-
83
-
84
-
85
-
86
-
87
-
88
-
89
-
90
-
91
-
92
-
93
-
94
-
95
-
96
-
97
-
98
-
99
-
100
-
101
-
102
-
103
-
104
-
105
-
106
-
107
-
108
-
109
-
110
-
111
-
112
-
113
-
114
-
115
-
116
-
117
-
118
-
119
-
120
-
121
-
122
-
123
-
124
-
125
-
126
-
127
-
128
-
129
-
130
-
131
-
132
-
133
-
134
-
135
-
136
-
137
-
138
-
139
-
140
-
141
-
142
 |
 |

{ 04 } { TCF Financial Corporation and Subsidiaries }
• Capital Actions
TCF took several actions to improve its capital
position during the year including the issuances
of $110 million of 6.25 percent subordinated
notes, $172.5 million of 7.50 percent Series A
Non-Cumulative Perpetual Preferred Stock and
$100 million of 6.45 percent Series B Non-
Cumulative Perpetual Preferred Stock. The funds
raised through these capital offerings are being
used to support current and future asset growth
opportunities, including the growth in our national
lending businesses. The capital issuances enabled
TCF to redeem its $115 million of 10.75 percent trust
preferred securities, which would have been phased
out from qualifying as Tier 1 capital over time.
• Return of Free Checking
TCF, like many large banks, eliminated its free
checking product following the implementation
of the Durbin Amendment in October 2011, which
limits debit card interchange revenue. After
listening to its customers and employees, TCF
decided to return to what made it so successful for
so many years — free checking. Since the return of
free checking, TCF has seen a steady increase in
new account production and a decrease in account
attrition. TCF customers and employees are happy
to have one of the most competitive checking
accounts in the country — TCF Free Checking.
SM
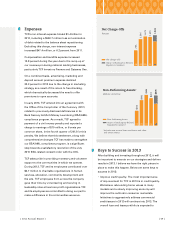
For the first time in 22 years, TCF incurred a net loss in
2012 of $218.5 million, or $1.37 per diluted share. This
loss was the result of the $295.8 million net after-tax
charge related to the balance sheet repositioning.
While TCF prides itself on being a profitable bank and
providing a strong return to shareholders, completing
the balance sheet repositioning in 2012 was the right
thing to do for the company and our stockholders.
TCF remains solidly capitalized with ample liquidity
to conduct business. The capital raising activities
completed during the year have enhanced our ability
to grow the balance sheet. At December 31, 2012,
TCF had $1.6 billion of Tier 1 capital, or 11.09 percent
of total risk-weighted assets.
TCF paid dividends totaling $.20 per share in 2012
and has now paid a dividend in 98 consecutive
quarters. When capital accumulation from earnings
exceeds capital required for asset growth and risk
parameters permit, TCF expects to raise the
dividend. Returning capital to stockholders remains
an important part of how we deliver value.
At December 31, 2012, TCF’s stock price closed
at $12.15 per share, up from $10.32 per share on
December 31, 2011. We believe that credit quality
remained the main issue impacting the stock price
throughout the year. As we continue to execute on
our strategies and home values improve, we expect
the stock price will improve over time.
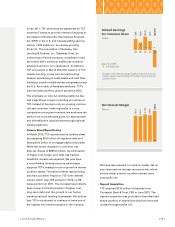
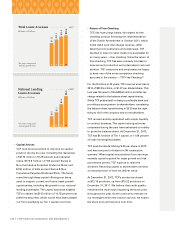
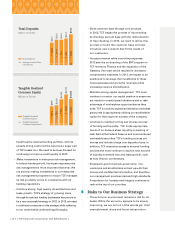
Total Loans & Leases
Billions of Dollars
12100806
$11.5
$13.3
$14.8
$15.4
+5%*
* Six-year compound
annual growth rate
National Lending
Loans & Leases
Billions of Dollars
12100806
$1.8
$2.5
$3.9
$5.3
+20%*
* Six-year compound
annual growth rate