TCF Bank 2012 Annual Report Download - page 59
Download and view the complete annual report
Please find page 59 of the 2012 TCF Bank annual report below. You can navigate through the pages in the report by either clicking on the pages listed below, or by using the keyword search tool below to find specific information within the annual report.-
 1
1 -
2
-
3
-
4
-
5
-
6
-
7
-
8
-
9
-
10
-
11
-
12
-
13
-
14
-
15
-
16
-
17
-
18
-
19
-
20
-
21
-
22
-
23
-
24
-
25
-
26
-
27
-
28
-
29
-
30
-
31
-
32
-
33
-
34
-
35
-
36
-
37
-
38
-
39
-
40
-
41
-
42
-
43
-
44
-
45
-
46
-
47
-
48
-
 49
49 -
 50
50 -
 51
51 -
 52
52 -
 53
53 -
 54
54 -
 55
55 -
 56
56 -
 57
57 -
 58
58 -
 59
59 -
 60
60 -
 61
61 -
 62
62 -
 63
63 -
 64
64 -
 65
65 -
 66
66 -
 67
67 -
 68
68 -
 69
69 -
70
-
71
-
72
-
73
-
74
-
75
-
76
-
77
-
78
-
79
-
80
-
81
-
82
-
83
-
84
-
85
-
86
-
87
-
88
-
89
-
90
-
91
-
92
-
93
-
94
-
95
-
96
-
97
-
98
-
99
-
100
-
101
-
102
-
103
-
104
-
105
-
106
-
107
-
108
-
109
-
110
-
111
-
112
-
113
-
114
-
115
-
116
-
117
-
118
-
119
-
120
-
121
-
122
-
123
-
124
-
125
-
126
-
127
-
128
-
129
-
130
-
131
-
132
-
133
-
134
-
135
-
136
-
137
-
138
-
139
-
140
-
141
-
142
 |
 |

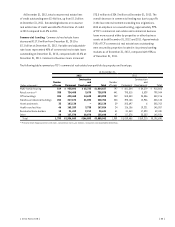
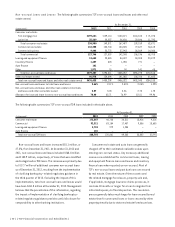
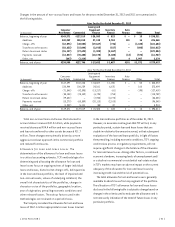
The following tables set forth a reconciliation of changes in the allowance for loan and lease losses.
Year Ended December 31,
(Dollars in thousands) 2012 2011 2010 2009 2008
Balance, at beginning of year $ 255,672 $ 265,819 $ 244,471 $ 172,442 $ 80,942
Charge-offs:
Consumer real estate:
First mortgage lien (101,595) (94,724) (78,605) (55,420) (30,262)
Junior lien (83,190) (62,130) (56,125) (53,137) (32,937)
Total consumer real estate (184,785) (156,854) (134,730) (108,557) (63,199)
Commercial real estate (34,642) (32,890) (45,682) (35,956) (11,884)
Commercial business (6,194) (9,843) (4,045) (9,810) (5,731)
Total commercial (40,836) (42,733) (49,727) (45,766) (17,615)
Leasing and equipment finance (15,248) (16,984) (34,745) (29,372) (13,156)
Inventory finance (1,838) (1,044) (1,484) (205) –
Auto Finance (1,164) – – – –
Other (10,239) (12,680) (16,377) (18,498) (20,830)
Total charge-offs (254,110) (230,295) (237,063) (202,398) (114,800)
Recoveries:
Consumer real estate:
First mortgage lien 1,067 510 2,237 808 210
Junior lien 4,582 3,233 2,633 1,129 625
Total consumer real estate 5,649 3,743 4,870 1,937 835
Commercial real estate 1,762 1,502 724 440 30
Commercial business 197 152 603 697 130
Total commercial 1,959 1,654 1,327 1,137 160
Leasing and equipment finance 5,058 4,461 4,100 2,053 1,735
Inventory finance 333 193 339 23 –
Auto Finance 30 – – – –
Other 7,314 9,262 11,338 10,741 11,525
Total recoveries 20,343 19,313 21,974 15,891 14,255
Net charge-offs (233,767) (210,982) (215,089) (186,507) (100,545)
Provision charged to operations 247,443 200,843 236,437 258,536 192,045
Other (2,220) (8) – – –
Balance, at end of year $ 267,128 $ 255,672 $ 265,819 $ 244,471 $ 172,442
Net charge-offs as a percentage of average loans and leases 1.54% 1.45% 1.47% 1.34% .78%
Consumer real estate net charge-offs during 2012
increased $26 million from 2011. The increase was primarily
due to additional net charge offs of $49.3 million related
to the impact of bankruptcy-related regulatory guidance
adopted in 2012, partially offset by improved portfolio
performance as a result of increasing residential real
estate values. During 2012, commercial net charge-
offs decreased $2.2 million from 2011, primarily due to
decreased net charge-offs related to commercial and
industrial loans in Illinois, partially offset by an increase
in net charge-offs in retail services in Michigan. Leasing
and equipment finance net charge-offs in 2012 decreased
$2.3 million from 2011, primarily due to decreases in the
middle market and small ticket segments, partially offset
by an increase in Winthrop charge-offs due to one large
lease exposure.
{ 2012 Form 10K } { 43 }