TCF Bank 2012 Annual Report Download - page 70
Download and view the complete annual report
Please find page 70 of the 2012 TCF Bank annual report below. You can navigate through the pages in the report by either clicking on the pages listed below, or by using the keyword search tool below to find specific information within the annual report.-
 1
1 -
2
-
3
-
4
-
5
-
6
-
7
-
8
-
9
-
10
-
11
-
12
-
13
-
14
-
15
-
16
-
17
-
18
-
19
-
20
-
21
-
22
-
23
-
24
-
25
-
26
-
27
-
28
-
29
-
30
-
31
-
32
-
33
-
34
-
35
-
36
-
37
-
38
-
39
-
40
-
41
-
42
-
43
-
44
-
45
-
46
-
47
-
48
-
49
-
50
-
51
-
52
-
53
-
54
-
55
-
56
-
57
-
58
-
59
-
 60
60 -
 61
61 -
 62
62 -
 63
63 -
 64
64 -
 65
65 -
 66
66 -
 67
67 -
 68
68 -
 69
69 -
 70
70 -
 71
71 -
 72
72 -
 73
73 -
 74
74 -
 75
75 -
 76
76 -
 77
77 -
 78
78 -
 79
79 -
 80
80 -
81
-
82
-
83
-
84
-
85
-
86
-
87
-
88
-
89
-
90
-
91
-
92
-
93
-
94
-
95
-
96
-
97
-
98
-
99
-
100
-
101
-
102
-
103
-
104
-
105
-
106
-
107
-
108
-
109
-
110
-
111
-
112
-
113
-
114
-
115
-
116
-
117
-
118
-
119
-
120
-
121
-
122
-
123
-
124
-
125
-
126
-
127
-
128
-
129
-
130
-
131
-
132
-
133
-
134
-
135
-
136
-
137
-
138
-
139
-
140
-
141
-
142
 |
 |

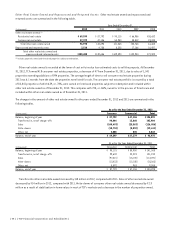
$108 million, or 22.4%, in the first year. A slowing in
prepayments would increase the estimated life of the
portfolios and may also adversely impact net interest
income or net interest margin in the future. The level of
prepayments that would actually occur in any scenario will
be impacted by factors other than interest rates, such as
lenders’ willingness to lend funds, which can be impacted
by the value of assets underlying loans and leases.
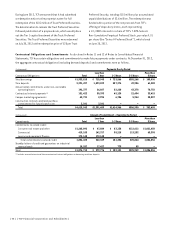
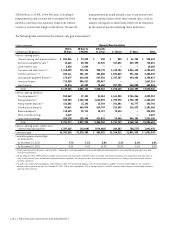
The following table summarizes the interest-rate gap measurement.
(Dollars in thousands) Maturity/Rate Sensitivity
Contractual Obligations
Within
30 Days
30 Days to
6 Months
6 Months
to 1 Year 1-3 Years 3+ Years Total
Interest-earning assets:
Interest earning cash and investments $ 807,565 $ 79,032 $ 100 $ 500 $ 41,235 $ 928,432
Securities available for sale(1) 14,622 50,453 51,925 157,692 437,399 712,091
Loans held for sale 3,430 6,859 – – – 10,289
Consumer and other loans(1) (2) 1,768,433 370,896 380,770 1,160,701 3,021,625 6,702,425
Commercial loans(1) (2) 652,111 306,151 401,058 1,094,069 951,846 3,405,235
Leasing and equipment finance(1) 175,477 624,025 567,926 1,337,387 493,202 3,198,017
Inventory finance 713,330 500,817 353,067 – – 1,567,214
Auto Finance 14,374 69,909 75,680 227,785 165,085 552,833
Total 4,149,342 2,008,142 1,830,526 3,978,134 5,110,392 17,076,536
Interest-bearing liabilities:
Checking deposits(3) 852,562 27,481 31,263 1,161,955 2,756,046 4,829,307
Savings deposits(3) 523,835 1,106,580 1,014,598 1,702,978 1,756,189 6,104,180
Money market deposits(3) 316,582 13,102 13,784 251,501 46,777 641,746
Certificates of deposits 89,461 649,074 813,799 513,359 115,575 2,181,268
Brokered deposits 110,433 92,711 18,727 72,414 – 294,285
Short-term borrowings 2,619 – – – – 2,619
Long-term borrowings 856,225 138,434 412,815 29,540 494,182 1,931,196
Total 2,751,717 2,027,382 2,304,986 3,731,747 5,168,769 15,984,601
Interest-earning assets (under) over
interest-bearing liabilities 1,397,625 (19,240) (474,460) 246,387 (58,377) 1,091,935
Cumulative gap $1,397,625 $1,378,385 $ 903,925 $1,150,312 $1,091,935 $ 1,091,935
Cumulative gap as a percentage
of total assets:
At December 31, 2012 7.7% 7.6% 5.0% 6.3% 6.0% 6.0%
At December 31, 2011 9.8% 9.4% 10.9% 20.0% 5.8% 5.8%
(1) Based upon contractual maturity, repricing date, if applicable, scheduled repayments of principal and projected prepayments of principal based upon experience and
third-party projections.
(2) At December 31, 2012, $999 million of variable-rate consumer real estate loans and $299 million of variable-rate commercial loans were modeled as fixed rate loans as
their current interest rate is below their contractual interest rate floor. An increase in short-term interest rates may not result in a change in the interest rate on these
variable-rate loans.
(3)
Includes non-interest bearing deposits. At December 31, 2012, 19% of checking deposits, 43% of savings deposits, and 54% of money market deposits are included in
amounts repricing within one year. At December 31, 2011, 15% of checking deposits, 42% of savings deposits, and 53% of money market deposits are included in amounts
repricing within one year.
{ 54 } { TCF Financial Corporation and Subsidiaries }