TCF Bank 2012 Annual Report Download - page 41
Download and view the complete annual report
Please find page 41 of the 2012 TCF Bank annual report below. You can navigate through the pages in the report by either clicking on the pages listed below, or by using the keyword search tool below to find specific information within the annual report.-
 1
1 -
2
-
3
-
4
-
5
-
6
-
7
-
8
-
9
-
10
-
11
-
12
-
13
-
14
-
15
-
16
-
17
-
18
-
19
-
20
-
21
-
22
-
23
-
24
-
25
-
26
-
27
-
28
-
29
-
30
-
 31
31 -
 32
32 -
 33
33 -
 34
34 -
 35
35 -
 36
36 -
 37
37 -
 38
38 -
 39
39 -
 40
40 -
 41
41 -
 42
42 -
 43
43 -
 44
44 -
 45
45 -
 46
46 -
 47
47 -
 48
48 -
 49
49 -
 50
50 -
 51
51 -
52
-
53
-
54
-
55
-
56
-
57
-
58
-
59
-
60
-
61
-
62
-
63
-
64
-
65
-
66
-
67
-
68
-
69
-
70
-
71
-
72
-
73
-
74
-
75
-
76
-
77
-
78
-
79
-
80
-
81
-
82
-
83
-
84
-
85
-
86
-
87
-
88
-
89
-
90
-
91
-
92
-
93
-
94
-
95
-
96
-
97
-
98
-
99
-
100
-
101
-
102
-
103
-
104
-
105
-
106
-
107
-
108
-
109
-
110
-
111
-
112
-
113
-
114
-
115
-
116
-
117
-
118
-
119
-
120
-
121
-
122
-
123
-
124
-
125
-
126
-
127
-
128
-
129
-
130
-
131
-
132
-
133
-
134
-
135
-
136
-
137
-
138
-
139
-
140
-
141
-
142
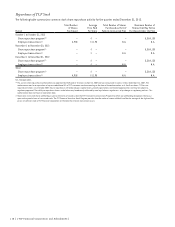
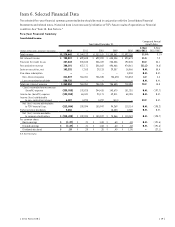
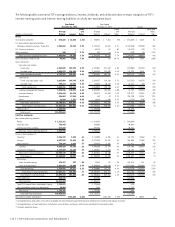
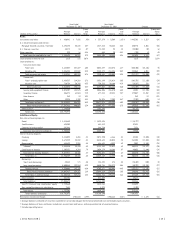
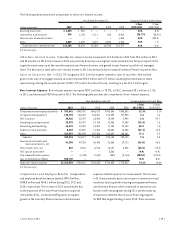
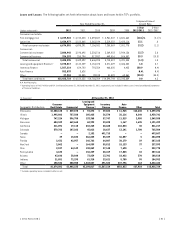
 |
 |

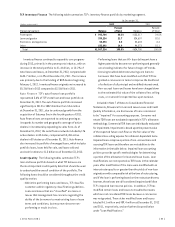
Year Ended
December 31, 2011
Year Ended
December 31, 2010 Change
(Dollars in thousands)
Average
Balance Interest
Yields
and
Rates
Average
Balance Interest
Yields
and
Rates
Average
Balance Interest
Yields and
Rates
(bps)
Assets:
Investments and other $ 820,981 $ 7,836 .95% $ 337,279 $ 5,509 1.63 % $ 483,702 $ 2,327 (68)
U.S. Government sponsored entities:
Mortgage-backed securities, fixed rate 2,198,188 85,138 3.87 1,817,413 80,332 4.42 380,775 4,806 (55)
U.S. Treasury securities 48,178 34 .07 71,233 93 .13 (23,055) (59) (6)
Other securities 329 16 4.86 454 20 4.41 (125) (4) 45
Total securities available for sale(1) 2,246,695 85,188 3.79 1,889,100 80,445 4.26 357,595 4,743 (47)
Loans and leases held for sale 1,215 131 10.78 – – 1,215 131 1,078
Loans and leases:
Consumer real estate:
Fixed-rate 4,627,047 281,427 6.08 5,082,487 313,573 6.17 (455,440) (32,146) (9)
Variable-rate 2,386,234 122,532 5.13 2,148,171 116,436 5.42 238,063 6,096 (29)
Total consumer real estate 7,013,281 403,959 5.76 7,230,658 430,009 5.95 (217,377) (26,050) (19)
Commercial:
Fixed- and adjustable-rate 2,854,327 164,368 5.76 2,956,699 176,018 5.95 (102,372) (11,650) (19)
Variable-rate 710,758 30,742 4.33 730,325 30,604 4.19 (19,567) 138 14
Total commercial 3,565,085 195,110 5.47 3,687,024 206,622 5.60 (121,939) (11,512) (13)
Leasing and equipment finance 3,074,207 184,575 6.00 3,056,006 196,570 6.43 18,201 (11,995) (43)
Inventory finance 856,271 61,583 7.19 677,214 49,881 7.37 179,057 11,702 (18)
Auto finance 363 13 3.31 – – – 363 13 331
Other 19,324 1,702 8.81 26,576 2,303 8.67 (7,252) (601) 14
Total loans and leases(2) 14,528,531 846,942 5.83 14,677,478 885,385 6.03 (148,947) (38,443) (20)
Total interest-earning assets 17,597,422 940,097 5.34 16,903,857 971,339 5.75 693,565 (31,242) (41)
Other assets(3) 1,194,550 1,286,683 (92,133)
Total assets $18,791,972 $18,190,540 $ 601,432
Liabilities and Equity:
Non-interest bearing deposits:
Retail $ 1,414,659 $ 1,429,436 $ (14,777)
Small business 698,903 641,412 57,491
Commercial and custodial 291,986 284,750 7,236
Total non-interest bearing deposits 2,405,548 2,355,598 49,950
Interest-bearing deposits:
Checking 2,114,098 4,451 .21 2,071,990 6,466 .31 42,108 (2,015) (10)
Savings 5,671,889 28,942 .51 5,410,681 40,023 .74 261,208 (11,081) (23)
Money market 658,693 2,951 .45 656,691 4,532 .69 2,002 (1,581) (24)
Subtotal 8,444,680 36,344 .43 8,139,362 51,021 .63 305,318 (14,677) (20)
Certificates of deposit 1,103,231 8,764 .79 1,054,179 10,208 .97 49,052 (1,444) (18)
Total interest-bearing deposits 9,547,911 45,108 .47 9,193,541 61,229 .67 354,370 (16,121) (20)
Total deposits 11,953,459 45,108 .38 11,549,139 61,229 .53 404,320 (16,121) (15)
Borrowings:
Short-term borrowings 49,442 171 .35 124,891 474 .38 (75,449) (303) (3)
Long-term borrowings 4,500,564 192,984 4.29 4,580,786 208,972 4.56 (80,222) (15,988) (27)
Total borrowings 4,550,006 193,155 4.24 4,705,677 209,446 4.45 (155,671) (16,291) (21)
Total interest-bearing liabilities 14,097,917 238,263 1.69 13,899,218 270,675 1.95 198,699 (32,412) (26)
Total deposits and borrowings 16,503,465 238,263 1.44 16,254,816 270,675 1.66 248,649 (32,412) (22)
Other liabilities 551,206 511,589 39,617
Total liabilities 17,054,671 16,766,405 288,266
Total TCF Financial Corp. stockholders’ equity 1,729,660 1,415,161 314,499
Non-controlling interest in subsidiaries 7,641 8,974 (1,333)
Total equity 1,737,301 1,424,135 313,166
Total liabilities and equity $18,791,972 $18,190,540 $ 601,432
Net interest income and margin $701,834 3.99% $700,664 4.15% $ 1,170 (16)
(1) Average balances and yields of securities available for sale are based upon the historical amortized cost and exclude equity securities.
(2) Average balances of loans and leases include non-accrual loans and leases, and are presented net of unearned income.
(3) Includes operating leases.
{ 2012 Form 10K } { 25 }