TCF Bank 2012 Annual Report Download - page 43
Download and view the complete annual report
Please find page 43 of the 2012 TCF Bank annual report below. You can navigate through the pages in the report by either clicking on the pages listed below, or by using the keyword search tool below to find specific information within the annual report.-
 1
1 -
2
-
3
-
4
-
5
-
6
-
7
-
8
-
9
-
10
-
11
-
12
-
13
-
14
-
15
-
16
-
17
-
18
-
19
-
20
-
21
-
22
-
23
-
24
-
25
-
26
-
27
-
28
-
29
-
30
-
31
-
32
-
 33
33 -
 34
34 -
 35
35 -
 36
36 -
 37
37 -
 38
38 -
 39
39 -
 40
40 -
 41
41 -
 42
42 -
 43
43 -
 44
44 -
 45
45 -
 46
46 -
 47
47 -
 48
48 -
 49
49 -
 50
50 -
 51
51 -
 52
52 -
 53
53 -
54
-
55
-
56
-
57
-
58
-
59
-
60
-
61
-
62
-
63
-
64
-
65
-
66
-
67
-
68
-
69
-
70
-
71
-
72
-
73
-
74
-
75
-
76
-
77
-
78
-
79
-
80
-
81
-
82
-
83
-
84
-
85
-
86
-
87
-
88
-
89
-
90
-
91
-
92
-
93
-
94
-
95
-
96
-
97
-
98
-
99
-
100
-
101
-
102
-
103
-
104
-
105
-
106
-
107
-
108
-
109
-
110
-
111
-
112
-
113
-
114
-
115
-
116
-
117
-
118
-
119
-
120
-
121
-
122
-
123
-
124
-
125
-
126
-
127
-
128
-
129
-
130
-
131
-
132
-
133
-
134
-
135
-
136
-
137
-
138
-
139
-
140
-
141
-
142
 |
 |

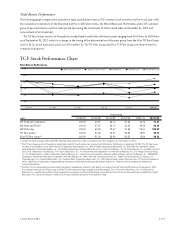
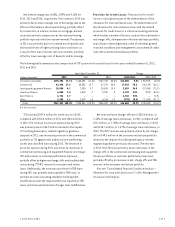
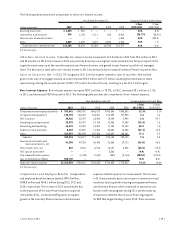
Net interest margin was 4.65%, 3.99% and 4.15% for
2012, 2011 and 2010, respectively. The increase in 2012 was
primarily due to lower average cost of borrowings due to the
effects of the balance sheet repositioning, partially offset
by a reduction in interest income on mortgage-backed
securities and rate compression as the national lending
portfolio repriced in the low rate environment. The decrease
in 2011 was primarily due to increased asset liquidity and
decreased levels of higher yielding loans and leases as
a result of the lower interest rate environment, partially
offset by lower average cost of deposits and borrowings.
Provision for Credit Losses The provision for credit
losses is calculated as part of the determination of the
allowance for loan and lease losses. The determination of
the allowance for loan and lease losses and the related
provision for credit losses is a critical accounting estimate
which involves a number of factors, such as historical trends in
net charge-offs, delinquencies in the loan and lease portfolio,
year of loan or lease origination, value of collateral, general
economic conditions and management’s assessment of credit
risk in the current loan and lease portfolio.
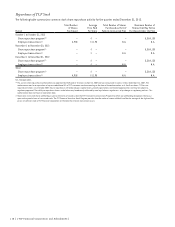
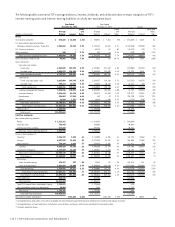
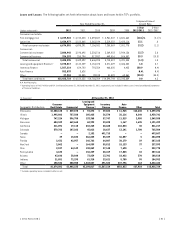
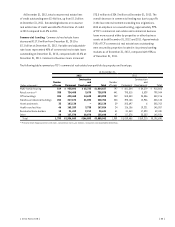
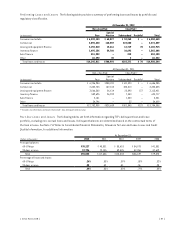
The following table summarizes the composition of TCF’s provision for credit losses for the years ended December 31, 2012,
2011 and 2010.
Year Ended December 31, Change
(Dollars in thousands) 2012 2011 2010 2012/2011 2011/2010
Consumer real estate $178,496 72.1% $163,696 81.5% $137,746 58.3% $14,800 9.0% $ 25,950 18.8%
Commercial 43,498 17.6 25,555 12.7 67,374 28.5 17,943 70.2 (41,819) (62.1)
Leasing and equipment finance 10,054 4.1 7,395 3.7 24,883 10.5 2,659 36.0 (17,488) (70.3)
Inventory finance 6,060 2.4 1,318 .7 2,220 .9 4,742 N.M. (902) (40.6)
Auto finance 6,726 2.7 – – – – 6,726 N.M. – N.M.
Other 2,609 1.1 2,879 1.4 4,214 1.8 (270) (9.4) (1,335) (31.7)
Total $247,443 100.0% $200,843 100.0% $236,437 100.0% $46,600 23.2% $(35,594) (15.1)%
N.M. Not Meaningful.
TCF provided $247.4 million for credit losses in 2012,
compared with $200.8 million in 2011 and $236.4 million
in 2010. The increase in provision expense during 2012
was primarily due to $36.9 million related to the impact
of clarifying bankruptcy-related regulatory guidance
adopted in 2012, and increased provision in the commercial
portfolio as TCF aggressively addressed non-performing
assets and classified loans during 2012. The decrease in
provision expense during 2011 was driven by decreases in
commercial and leasing and equipment finance net charge-
offs and reserves as customer performance improved,
partially offset by higher net charge-offs and troubled debt
restructuring (“TDR”) reserves for consumer real estate
loans. Additionally, the increase in provision for TDR loans
during 2011 was primarily due to growth in TDR loans, in
part due to a new accounting standard clarifying what
modifications meet the requirements to be reported as TDR
loans, and increased utilization of longer term modifications.
Net loan and lease charge-offs were $233.8 million, or
1.54% of average loans and leases, in 2012, compared with
$211 million, or 1.45% of average loans and leases, in 2011
and $215.1 million, or 1.47% of average loans and leases, in
2010. The 2012 increase was primarily driven by net charge-
offs of $49.3 million in the consumer real estate portfolio
related to the impact of clarifying bankruptcy-related
regulatory guidance previously discussed. The decrease
in 2011 from 2010 was primarily due to decreases in net
charge-offs in the commercial and leasing and equipment
finance portfolios as customer performance improved,
partially offset by an increase in net-charge offs and TDR
reserves in the consumer real estate portfolio.
Also see “Consolidated Financial Condition Analysis —
Allowance for Loan and Lease Losses” in this Management’s
Discussion and Analysis.
{ 2012 Form 10K } { 27 }