Starwood 2005 Annual Report Download - page 78
Download and view the complete annual report
Please find page 78 of the 2005 Starwood annual report below. You can navigate through the pages in the report by either clicking on the pages listed below, or by using the keyword search tool below to find specific information within the annual report.-
 1
1 -
2
-
3
-
4
-
5
-
6
-
7
-
8
-
9
-
10
-
11
-
12
-
13
-
14
-
15
-
16
-
17
-
18
-
19
-
20
-
21
-
22
-
23
-
24
-
25
-
26
-
27
-
28
-
29
-
30
-
31
-
32
-
33
-
34
-
35
-
36
-
37
-
38
-
39
-
40
-
41
-
42
-
43
-
44
-
45
-
46
-
47
-
48
-
49
-
50
-
51
-
52
-
53
-
54
-
55
-
56
-
57
-
58
-
59
-
60
-
61
-
62
-
63
-
64
-
65
-
66
-
67
-
 68
68 -
 69
69 -
 70
70 -
 71
71 -
 72
72 -
 73
73 -
 74
74 -
 75
75 -
 76
76 -
 77
77 -
 78
78 -
 79
79 -
 80
80 -
 81
81 -
 82
82 -
 83
83 -
 84
84 -
 85
85 -
 86
86 -
 87
87 -
 88
88 -
89
-
90
-
91
-
92
-
93
-
94
-
95
-
96
-
97
-
98
-
99
-
100
-
101
-
102
-
103
-
104
-
105
-
106
-
107
-
108
-
109
-
110
-
111
-
112
-
113
-
114
-
115
-
116
-
117
-
118
-
119
-
120
-
121
-
122
-
123
-
124
-
125
-
126
-
127
-
128
-
129
-
130
-
131
-
132
-
133
 |
 |

STARWOOD HOTELS & RESORTS WORLDWIDE, INC.
AND STARWOOD HOTELS & RESORTS
NOTES TO FINANCIAL STATEMENTS Ì (Continued)
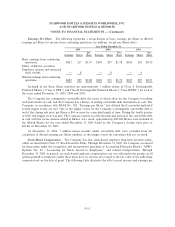
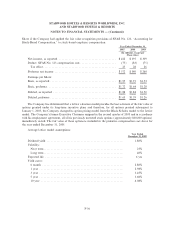
Earnings Per Share. The following represents a reconciliation of basic earnings per Share to diluted
earnings per Share for income from continuing operations (in millions, except per Share data):
Year Ended December 31,
2005 2004 2003
Per Per Per
Earnings Shares Share Earnings Shares Share Earnings Shares Share
Basic earnings from continuing
operationsÏÏÏÏÏÏÏÏÏÏÏÏÏÏÏÏÏ $423 217 $1.95 $369 207 $1.78 $105 203 $0.52
EÅect of dilutive securities:
Employee options and restricted
stock awards ÏÏÏÏÏÏÏÏÏÏÏÏÏÏ Ì 8 Ì 8 Ì 4
Diluted earnings from continuing
operations ÏÏÏÏÏÏÏÏÏÏÏÏÏÏÏÏÏ $423 225 $1.88 $369 215 $1.72 $105 207 $0.51
Included in the Basic Share numbers are approximately 1 million shares of Class A Exchangeable
Preferred Shares (""Class A EPS'') and Class B Exchangeable Preferred Shares (""Class B EPS'') for each of
the years ended December 31, 2005, 2004 and 2003.
The Company has contingently convertible debt, the terms of which allow for the Company to redeem
such instruments in cash, and the Company has a history of settling convertible debt instruments in cash. The
Company, in accordance with SFAS No. 128, ""Earnings per Share,'' has utilized the if-converted method if
certain trigger events are met. One of the trigger events for the Company's contingently convertible debt is
met if the closing sale price per Share is $60 or more for a speciÑed length of time. During the fourth quarter
of 2005, this trigger event was met. The Company expects to settle the principal portion of the convertible debt
in cash with the excess amount settled in Shares. As a result, approximately 400,000 Shares were included in
the diluted Shares for the year ended December 31, 2005 based on the Company's closing stock price of
$63.86 on December 30, 2005.
At December 31, 2004, 7 million shares issuable under convertible debt were excluded from the
calculation of diluted earnings per Share numbers as the trigger events for conversion had not occurred.
Stock-Based Compensation. The Company has four stock-based employee long-term incentive plans,
which are described in Note 19. Stock Incentive Plans. Through December 31, 2005, the Company accounted
for those plans under the recognition and measurement principles of Accounting Principles Board (""APB'')
Opinion No. 25, ""Accounting for Stock Issued to Employees,'' and related interpretations. Through
December 31, 2005, in general, no stock-based employee compensation cost was reÖected in net income as all
options granted to employees under these plans have an exercise price equal to the fair value of the underlying
common stock on the date of grant. The following table illustrates the eÅect on net income and earnings per
F-15