Starwood 2005 Annual Report Download - page 31
Download and view the complete annual report
Please find page 31 of the 2005 Starwood annual report below. You can navigate through the pages in the report by either clicking on the pages listed below, or by using the keyword search tool below to find specific information within the annual report.-
 1
1 -
2
-
3
-
4
-
5
-
6
-
7
-
8
-
9
-
10
-
11
-
12
-
13
-
14
-
15
-
16
-
17
-
18
-
19
-
20
-
 21
21 -
 22
22 -
 23
23 -
 24
24 -
 25
25 -
 26
26 -
 27
27 -
 28
28 -
 29
29 -
 30
30 -
 31
31 -
 32
32 -
 33
33 -
 34
34 -
 35
35 -
 36
36 -
 37
37 -
 38
38 -
 39
39 -
 40
40 -
 41
41 -
42
-
43
-
44
-
45
-
46
-
47
-
48
-
49
-
50
-
51
-
52
-
53
-
54
-
55
-
56
-
57
-
58
-
59
-
60
-
61
-
62
-
63
-
64
-
65
-
66
-
67
-
68
-
69
-
70
-
71
-
72
-
73
-
74
-
75
-
76
-
77
-
78
-
79
-
80
-
81
-
82
-
83
-
84
-
85
-
86
-
87
-
88
-
89
-
90
-
91
-
92
-
93
-
94
-
95
-
96
-
97
-
98
-
99
-
100
-
101
-
102
-
103
-
104
-
105
-
106
-
107
-
108
-
109
-
110
-
111
-
112
-
113
-
114
-
115
-
116
-
117
-
118
-
119
-
120
-
121
-
122
-
123
-
124
-
125
-
126
-
127
-
128
-
129
-
130
-
131
-
132
-
133
 |
 |

RESULTS OF OPERATIONS
The following discussion presents an analysis of results of our operations for the years ended Decem-
ber 31, 2005, 2004 and 2003.
Our operating results for 2005 and 2004 improved signiÑcantly when compared to 2003 due, in large part,
to the continued economic recovery in the United States, particularly its eÅect on the hospitality industry. Our
operating results for a substantial part of 2003 were signiÑcantly impacted by the weakened worldwide
economic environment, the war in Iraq and its aftermath and the Severe Acute Respiratory Syndrome
(""SARS'') epidemic, all of which resulted in a dramatic slowdown in business and international travel. In the
latter part of 2003 and continuing into 2004 and 2005, transient travel in North America, where we have our
largest concentration of owned hotels, began to increase, more than oÅsetting the weaknesses in group travel.
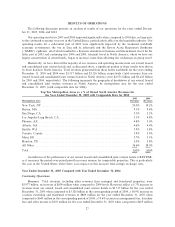
Historically, we have derived the majority of our revenues and operating income from our owned, leased
and consolidated joint venture hotels and, as discussed above, a signiÑcant portion of these results were driven
by these hotels in North America. Total revenues generated from these hotels worldwide for the years ending
December 31, 2005 and 2004 were $3.517 billion and $3.326 billion, respectively (total revenues from our
owned, leased and consolidated joint venture hotels in North America were $2.571 billion and $2.423 billion
for 2005 and 2004, respectively). The following represents the geographical breakdown of our owned, leased
and consolidated joint venture revenues in North America by metropolitan area for the year ended
December 31, 2005 (with comparable data for 2004):
Top Ten Metropolitan Areas as a % of Owned North America Revenues for
the Year Ended December 31, 2005 with Comparable Data for 2004
2005 2004
Metropolitan Area Revenues Revenues
New York, NY ÏÏÏÏÏÏÏÏÏÏÏÏÏÏÏÏÏÏÏÏÏÏÏÏÏÏÏÏÏÏÏÏÏÏÏÏÏÏÏÏÏÏÏÏÏÏÏÏÏÏÏÏÏÏÏÏÏÏÏÏ 20.0% 19.2%
Boston, MA ÏÏÏÏÏÏÏÏÏÏÏÏÏÏÏÏÏÏÏÏÏÏÏÏÏÏÏÏÏÏÏÏÏÏÏÏÏÏÏÏÏÏÏÏÏÏÏÏÏÏÏÏÏÏÏÏÏÏÏÏÏÏÏ 9.1% 9.4%
San Diego, CA ÏÏÏÏÏÏÏÏÏÏÏÏÏÏÏÏÏÏÏÏÏÏÏÏÏÏÏÏÏÏÏÏÏÏÏÏÏÏÏÏÏÏÏÏÏÏÏÏÏÏÏÏÏÏÏÏÏÏÏÏ 5.3% 5.2%
Los Angeles-Long Beach, CAÏÏÏÏÏÏÏÏÏÏÏÏÏÏÏÏÏÏÏÏÏÏÏÏÏÏÏÏÏÏÏÏÏÏÏÏÏÏÏÏÏÏÏÏÏÏÏÏ 5.1% 4.8%
Phoenix, AZ ÏÏÏÏÏÏÏÏÏÏÏÏÏÏÏÏÏÏÏÏÏÏÏÏÏÏÏÏÏÏÏÏÏÏÏÏÏÏÏÏÏÏÏÏÏÏÏÏÏÏÏÏÏÏÏÏÏÏÏÏÏÏ 4.8% 5.0%
Atlanta, GAÏÏÏÏÏÏÏÏÏÏÏÏÏÏÏÏÏÏÏÏÏÏÏÏÏÏÏÏÏÏÏÏÏÏÏÏÏÏÏÏÏÏÏÏÏÏÏÏÏÏÏÏÏÏÏÏÏÏÏÏÏÏÏ 4.6% 4.4%
Seattle, WAÏÏÏÏÏÏÏÏÏÏÏÏÏÏÏÏÏÏÏÏÏÏÏÏÏÏÏÏÏÏÏÏÏÏÏÏÏÏÏÏÏÏÏÏÏÏÏÏÏÏÏÏÏÏÏÏÏÏÏÏÏÏÏ 3.9% 3.8%
Toronto, Canada ÏÏÏÏÏÏÏÏÏÏÏÏÏÏÏÏÏÏÏÏÏÏÏÏÏÏÏÏÏÏÏÏÏÏÏÏÏÏÏÏÏÏÏÏÏÏÏÏÏÏÏÏÏÏÏÏÏÏÏ 3.9% 3.9%
Maui, HI ÏÏÏÏÏÏÏÏÏÏÏÏÏÏÏÏÏÏÏÏÏÏÏÏÏÏÏÏÏÏÏÏÏÏÏÏÏÏÏÏÏÏÏÏÏÏÏÏÏÏÏÏÏÏÏÏÏÏÏÏÏÏÏÏÏ 3.7% 3.5%
Houston, TX ÏÏÏÏÏÏÏÏÏÏÏÏÏÏÏÏÏÏÏÏÏÏÏÏÏÏÏÏÏÏÏÏÏÏÏÏÏÏÏÏÏÏÏÏÏÏÏÏÏÏÏÏÏÏÏÏÏÏÏÏÏÏ 3.0% 2.8%
All Other ÏÏÏÏÏÏÏÏÏÏÏÏÏÏÏÏÏÏÏÏÏÏÏÏÏÏÏÏÏÏÏÏÏÏÏÏÏÏÏÏÏÏÏÏÏÏÏÏÏÏÏÏÏÏÏÏÏÏÏÏÏÏÏÏÏ 36.6% 38.0%
Total ÏÏÏÏÏÏÏÏÏÏÏÏÏÏÏÏÏÏÏÏÏÏÏÏÏÏÏÏÏÏÏÏÏÏÏÏÏÏÏÏÏÏÏÏÏÏÏÏÏÏÏÏÏÏÏÏÏÏÏÏÏÏÏÏÏÏÏÏÏ 100% 100%
An indicator of the performance of our owned, leased and consolidated joint venture hotels is REVPAR,
as it measures the period-over-period growth in rooms revenue for comparable properties. This is particularly
the case in the United States where there is no impact on this measure from foreign exchange rates.
Year Ended December 31, 2005 Compared with Year Ended December 31, 2004
Continuing Operations
Revenues. Total revenues, including other revenues from managed and franchised properties, were
$5.977 billion, an increase of $609 million when compared to 2004 levels. Revenues reÖect a 5.7% increase in
revenues from our owned, leased and consolidated joint venture hotels to $3.517 billion for the year ended
December 31, 2005 when compared to $3.326 billion in the corresponding period of 2004, a 38.9% increase in
vacation ownership and residential revenues to $889 million for the year ended December 31, 2005 when
compared to $640 million in the corresponding period of 2004, a 19.6% increase in management fees, franchise
fees and other income to $501 million for the year ended December 31, 2005 when compared to $419 million
27