Starwood 2005 Annual Report Download - page 117
Download and view the complete annual report
Please find page 117 of the 2005 Starwood annual report below. You can navigate through the pages in the report by either clicking on the pages listed below, or by using the keyword search tool below to find specific information within the annual report.-
 1
1 -
2
-
3
-
4
-
5
-
6
-
7
-
8
-
9
-
10
-
11
-
12
-
13
-
14
-
15
-
16
-
17
-
18
-
19
-
20
-
21
-
22
-
23
-
24
-
25
-
26
-
27
-
28
-
29
-
30
-
31
-
32
-
33
-
34
-
35
-
36
-
37
-
38
-
39
-
40
-
41
-
42
-
43
-
44
-
45
-
46
-
47
-
48
-
49
-
50
-
51
-
52
-
53
-
54
-
55
-
56
-
57
-
58
-
59
-
60
-
61
-
62
-
63
-
64
-
65
-
66
-
67
-
68
-
69
-
70
-
71
-
72
-
73
-
74
-
75
-
76
-
77
-
78
-
79
-
80
-
81
-
82
-
83
-
84
-
85
-
86
-
87
-
88
-
89
-
90
-
91
-
92
-
93
-
94
-
95
-
96
-
97
-
98
-
99
-
100
-
101
-
102
-
103
-
104
-
105
-
106
-
 107
107 -
 108
108 -
 109
109 -
 110
110 -
 111
111 -
 112
112 -
 113
113 -
 114
114 -
 115
115 -
 116
116 -
 117
117 -
 118
118 -
 119
119 -
 120
120 -
 121
121 -
 122
122 -
 123
123 -
 124
124 -
 125
125 -
 126
126 -
 127
127 -
128
-
129
-
130
-
131
-
132
-
133
 |
 |

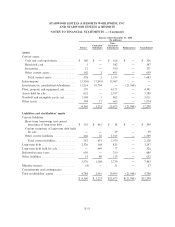
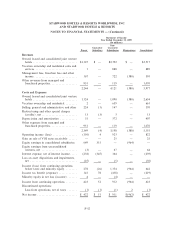
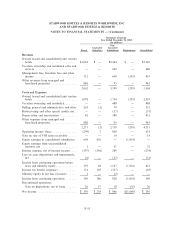
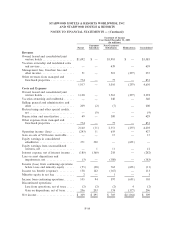
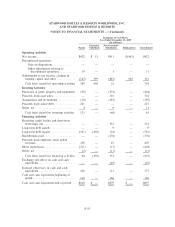
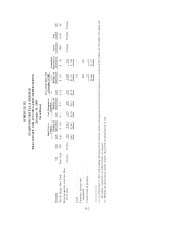
STARWOOD HOTELS & RESORTS WORLDWIDE, INC.
AND STARWOOD HOTELS & RESORTS
NOTES TO FINANCIAL STATEMENTS Ì (Continued)
Statement of Income
Year Ended December 31, 2003
(In millions)
Guarantor Non-Guarantor
Parent Subsidiary Subsidiaries Eliminations Consolidated
Revenues
Owned, leased and consolidated joint
venture hotels ÏÏÏÏÏÏÏÏÏÏÏÏÏÏÏÏÏÏÏÏÏÏ $1,092 $ Ì $1,993 $ Ì $3,085
Vacation ownership and residential sales
and servicesÏÏÏÏÏÏÏÏÏÏÏÏÏÏÏÏÏÏÏÏÏÏÏÏ Ì Ì 439 Ì 439
Management fees, franchise fees and
other incomeÏÏÏÏÏÏÏÏÏÏÏÏÏÏÏÏÏÏÏÏÏÏÏ 51 Ì 501 (297) 255
Other revenues from managed and
franchised properties ÏÏÏÏÏÏÏÏÏÏÏÏÏÏÏÏ 774 Ì 77 Ì 851
1,917 Ì 3,010 (297) 4,630
Costs and Expenses
Owned, leased and consolidated joint
venture hotels ÏÏÏÏÏÏÏÏÏÏÏÏÏÏÏÏÏÏÏÏÏÏ 1,128 Ì 1,561 (297) 2,392
Vacation ownership and residential ÏÏÏÏÏÏÏ Ì Ì 340 Ì 340
Selling, general and administrative and
other ÏÏÏÏÏÏÏÏÏÏÏÏÏÏÏÏÏÏÏÏÏÏÏÏÏÏÏÏÏ 209 (2) (7) Ì 200
Restructuring and other special credits,
net ÏÏÏÏÏÏÏÏÏÏÏÏÏÏÏÏÏÏÏÏÏÏÏÏÏÏÏÏÏÏÏ Ì (9) Ì Ì (9)
Depreciation and amortization ÏÏÏÏÏÏÏÏÏÏ 49 Ì 380 Ì 429
Other expenses from managed and
franchised properties ÏÏÏÏÏÏÏÏÏÏÏÏÏÏÏÏ 774 Ì 77 Ì 851
2,160 (11) 2,351 (297) 4,203
Operating income (loss) ÏÏÏÏÏÏÏÏÏÏÏÏÏÏÏ (243) 11 659 Ì 427
Gain on sale of VOI notes receivable ÏÏÏÏÏ Ì Ì 15 Ì 15
Equity earnings in consolidated
subsidiaries ÏÏÏÏÏÏÏÏÏÏÏÏÏÏÏÏÏÏÏÏÏÏÏÏ 371 320 Ì (691) Ì
Equity earnings from unconsolidated
ventures, net ÏÏÏÏÏÏÏÏÏÏÏÏÏÏÏÏÏÏÏÏÏÏÏ Ì 1 11 Ì 12
Interest expense, net of interest income ÏÏ (180) (360) 258 Ì (282)
Loss on asset dispositions and
impairments, netÏÏÏÏÏÏÏÏÏÏÏÏÏÏÏÏÏÏÏÏ (3) Ì (180) Ì (183)
Income (loss) from continuing operations
before taxes and minority equity ÏÏÏÏÏÏ (55) (28) 763 (691) (11)
Income tax beneÑt (expense)ÏÏÏÏÏÏÏÏÏÏÏ 158 122 (167) Ì 113
Minority equity in net loss ÏÏÏÏÏÏÏÏÏÏÏÏÏ 2 Ì 1 Ì 3
Income from continuing operationsÏÏÏÏÏÏÏ 105 94 597 (691) 105
Discontinued operations:
Loss from operations, net of taxes ÏÏÏÏÏ (2) (2) (2) 4 (2)
Gain on dispositions, net of taxesÏÏÏÏÏÏ 206 203 174 (377) 206
Net income ÏÏÏÏÏÏÏÏÏÏÏÏÏÏÏÏÏÏÏÏÏÏÏÏÏÏ $ 309 $ 295 $ 769 $(1,064) $ 309
F-54