Starwood 2005 Annual Report Download - page 34
Download and view the complete annual report
Please find page 34 of the 2005 Starwood annual report below. You can navigate through the pages in the report by either clicking on the pages listed below, or by using the keyword search tool below to find specific information within the annual report.-
 1
1 -
2
-
3
-
4
-
5
-
6
-
7
-
8
-
9
-
10
-
11
-
12
-
13
-
14
-
15
-
16
-
17
-
18
-
19
-
20
-
21
-
22
-
23
-
 24
24 -
 25
25 -
 26
26 -
 27
27 -
 28
28 -
 29
29 -
 30
30 -
 31
31 -
 32
32 -
 33
33 -
 34
34 -
 35
35 -
 36
36 -
 37
37 -
 38
38 -
 39
39 -
 40
40 -
 41
41 -
 42
42 -
 43
43 -
 44
44 -
45
-
46
-
47
-
48
-
49
-
50
-
51
-
52
-
53
-
54
-
55
-
56
-
57
-
58
-
59
-
60
-
61
-
62
-
63
-
64
-
65
-
66
-
67
-
68
-
69
-
70
-
71
-
72
-
73
-
74
-
75
-
76
-
77
-
78
-
79
-
80
-
81
-
82
-
83
-
84
-
85
-
86
-
87
-
88
-
89
-
90
-
91
-
92
-
93
-
94
-
95
-
96
-
97
-
98
-
99
-
100
-
101
-
102
-
103
-
104
-
105
-
106
-
107
-
108
-
109
-
110
-
111
-
112
-
113
-
114
-
115
-
116
-
117
-
118
-
119
-
120
-
121
-
122
-
123
-
124
-
125
-
126
-
127
-
128
-
129
-
130
-
131
-
132
-
133
 |
 |
Discontinued Operations. For the year ended December 31, 2005, the loss from operations represents a
$2 million sales and use tax assessment related to periods prior to our disposal of our gaming business, which
was disposed of in 1999, oÅset by a $1 million income tax beneÑt related to this business.
For the year ended December 31, 2004, the net gain on dispositions includes $16 million related to the
favorable resolution of certain tax matters and $10 million primarily related to the reversal of reserves, both of
which related to our former gaming business. The reserves were reversed as the related contingencies were
resolved.
Income Tax Expense. The eÅective income tax rate for continuing operations for the year ended
December 31, 2005 was 34.1% compared to 10.5% in 2004. The increase was primarily due to $47 million of
tax expense on the adoption of a plan to repatriate foreign earnings in accordance with the American Jobs
Creation Act of 2004 and $52 million of additional tax expense related to our 1998 disposition of ITT World
Directories recorded in 2005. The eÅective tax rate for the year ended December 31, 2005 also includes a net
tax credit of $15 million related to the deferred gain on the sale of the Hotel Danieli in Venice, Italy and an
$8 million beneÑt related to tax refunds for tax years prior to the 1995 split-up of ITT Corporation. Our
eÅective income tax rate is determined by the level and composition of pre-tax income subject to varying
foreign, state and local taxes and other items. The eÅective tax rate for the year ended December 31, 2004
includes a $28 million beneÑt primarily related to the reversal of tax reserves as a result of the resolution of
certain tax matters during the year.
Year Ended December 31, 2004 Compared with Year Ended December 31, 2003
Continuing Operations
Revenues. Total revenues, including other revenues from managed and franchised properties, were
$5.368 billion, an increase of $738 million when compared to 2003 levels. Revenues reÖect a 7.8% increase in
revenues from our owned, leased and consolidated joint venture hotels to $3.326 billion for the year ended
December 31, 2004 when compared to $3.085 billion in the corresponding period of 2003, an increase of
$164 million in management fees, franchise fees and other income to $419 million for the year ended
December 31, 2004 when compared to $255 million in the corresponding period of 2003, an increase of
$201 million in vacation ownership and residential revenues to $640 million for the year ended December 31,
2004 when compared to $439 million in the corresponding period of 2003 and an increase of $132 million in
other revenues from managed and franchised properties to $983 million for the year ended December 31, 2004
when compared to $851 million in the corresponding period of 2003.
The increase in revenues from owned, leased and consolidated joint venture hotels is due in large part to
the continued economic recovery, particularly its eÅect on the hospitality industry. The war in Iraq, the SARS
epidemic and the weakened worldwide economic environment in 2003 negatively impacted the results for a
substantial part of the year ended December 31, 2003. Results in 2004 were also favorably impacted by the
addition of the Sheraton Kauai in Hawaii, which we acquired in March 2004. These improved results in 2004
were oÅset, in part, by the absence in 2004 of the revenues generated by 16 non-strategic domestic hotels and
four hotels in Costa Smeralda, Italy, which were, for the most part, sold in the Ñrst half of 2003. Revenues
from these hotels in 2003 were $110 million. Revenues at our hotels owned during both periods (""Same-Store
Owned Hotels'') (138 hotels for the year ended December 31, 2004 and 2003, excluding 26 hotels sold or
closed or without comparable results in 2004 and 2003) increased 11.4%, or $333 million, to $3.266 billion for
the year ended December 31, 2004 when compared to $2.933 billion in the same period of 2003 due primarily
to an increase in REVPAR. REVPAR at our Same-Store Owned Hotels increased 13.0% to $110.81 for the
year ended December 31, 2004 when compared to the corresponding 2003 period. The increase in REVPAR
was attributed to increases in occupancy rates to 68.5% in the year ended December 31, 2004 compared to
64.7% in the same period in 2003, and a 6.8% increase in ADR at these Same-Store Owned Hotels to $161.74
for the year ended December 31, 2004 compared to $151.49 for the corresponding 2003 period. REVPAR at
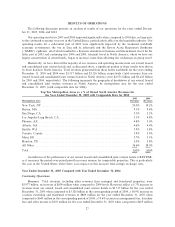
Same-Store Owned Hotels in North America increased 12.1% for the year ended December 31, 2004 when
compared to the same period of 2003 due to increased transient and group travel business for the period.
REVPAR growth at these hotels, and thereby revenues, was strongest in major metropolitan cities such as
30