Starwood 2005 Annual Report Download - page 115
Download and view the complete annual report
Please find page 115 of the 2005 Starwood annual report below. You can navigate through the pages in the report by either clicking on the pages listed below, or by using the keyword search tool below to find specific information within the annual report.-
 1
1 -
2
-
3
-
4
-
5
-
6
-
7
-
8
-
9
-
10
-
11
-
12
-
13
-
14
-
15
-
16
-
17
-
18
-
19
-
20
-
21
-
22
-
23
-
24
-
25
-
26
-
27
-
28
-
29
-
30
-
31
-
32
-
33
-
34
-
35
-
36
-
37
-
38
-
39
-
40
-
41
-
42
-
43
-
44
-
45
-
46
-
47
-
48
-
49
-
50
-
51
-
52
-
53
-
54
-
55
-
56
-
57
-
58
-
59
-
60
-
61
-
62
-
63
-
64
-
65
-
66
-
67
-
68
-
69
-
70
-
71
-
72
-
73
-
74
-
75
-
76
-
77
-
78
-
79
-
80
-
81
-
82
-
83
-
84
-
85
-
86
-
87
-
88
-
89
-
90
-
91
-
92
-
93
-
94
-
95
-
96
-
97
-
98
-
99
-
100
-
101
-
102
-
103
-
104
-
 105
105 -
 106
106 -
 107
107 -
 108
108 -
 109
109 -
 110
110 -
 111
111 -
 112
112 -
 113
113 -
 114
114 -
 115
115 -
 116
116 -
 117
117 -
 118
118 -
 119
119 -
 120
120 -
 121
121 -
 122
122 -
 123
123 -
 124
124 -
 125
125 -
126
-
127
-
128
-
129
-
130
-
131
-
132
-
133
 |
 |

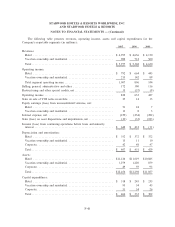
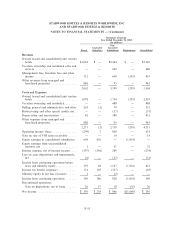
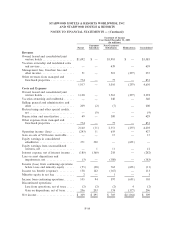
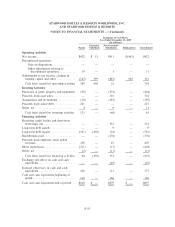
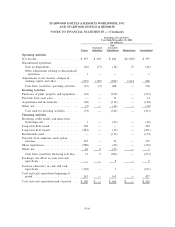
STARWOOD HOTELS & RESORTS WORLDWIDE, INC.
AND STARWOOD HOTELS & RESORTS
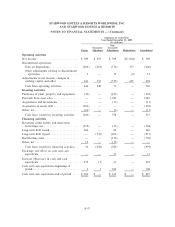
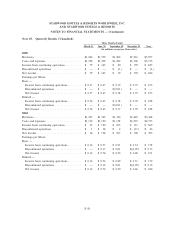
NOTES TO FINANCIAL STATEMENTS Ì (Continued)
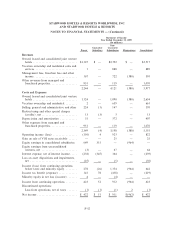
Statement of Income
Year Ended December 31, 2005
(In millions)
Non-
Guarantor Guarantor
Parent Subsidiary Subsidiaries Eliminations Consolidated
Revenues
Owned, leased and consolidated joint venture
hotels ÏÏÏÏÏÏÏÏÏÏÏÏÏÏÏÏÏÏÏÏÏÏÏÏÏÏÏÏÏÏÏ $1,125 $ Ì $2,392 $ Ì $3,517
Vacation ownership and residential sales and
servicesÏÏÏÏÏÏÏÏÏÏÏÏÏÏÏÏÏÏÏÏÏÏÏÏÏÏÏÏÏÏ 1 Ì 888 Ì 889
Management fees, franchise fees and other
income ÏÏÏÏÏÏÏÏÏÏÏÏÏÏÏÏÏÏÏÏÏÏÏÏÏÏÏÏÏÏ 167 Ì 722 (388) 501
Other revenues from managed and
franchised propertiesÏÏÏÏÏÏÏÏÏÏÏÏÏÏÏÏÏÏÏ 951 Ì 119 Ì 1,070
2,244 Ì 4,121 (388) 5,977
Costs and Expenses
Owned, leased and consolidated joint venture
hotels ÏÏÏÏÏÏÏÏÏÏÏÏÏÏÏÏÏÏÏÏÏÏÏÏÏÏÏÏÏÏÏ 1,124 Ì 1,898 (388) 2,634
Vacation ownership and residentialÏÏÏÏÏÏÏÏÏ 2 Ì 659 Ì 661
Selling, general and administrative and other 224 (1) 147 Ì 370
Restructuring and other special charges
(credits), netÏÏÏÏÏÏÏÏÏÏÏÏÏÏÏÏÏÏÏÏÏÏÏÏÏ 13 (3) 3 Ì 13
Depreciation and amortization ÏÏÏÏÏÏÏÏÏÏÏÏ 35 Ì 372 Ì 407
Other expenses from managed and
franchised propertiesÏÏÏÏÏÏÏÏÏÏÏÏÏÏÏÏÏÏÏ 951 Ì 119 Ì 1,070
2,349 (4) 3,198 (388) 5,155
Operating income (loss) ÏÏÏÏÏÏÏÏÏÏÏÏÏÏÏÏÏ (105) 4 923 Ì 822
Gain on sale of VOI notes receivable ÏÏÏÏÏÏ Ì Ì 25 Ì 25
Equity earnings in consolidated subsidiaries 649 315 Ì (964) Ì
Equity earnings from unconsolidated
ventures, net ÏÏÏÏÏÏÏÏÏÏÏÏÏÏÏÏÏÏÏÏÏÏÏÏÏ (3) Ì 67 Ì 64
Interest expense, net of interest incomeÏÏÏÏÏ (238) (345) 344 Ì (239)
Loss on asset dispositions and impairments,
net ÏÏÏÏÏÏÏÏÏÏÏÏÏÏÏÏÏÏÏÏÏÏÏÏÏÏÏÏÏÏÏÏÏ (25) Ì (5) Ì (30)
Income (loss) from continuing operations
before taxes and minority equityÏÏÏÏÏÏÏÏÏ 278 (26) 1,354 (964) 642
Income tax beneÑt (expense) ÏÏÏÏÏÏÏÏÏÏÏÏÏ 141 78 (438) Ì (219)
Minority equity in net loss (income) ÏÏÏÏÏÏÏ 4 Ì (4) Ì Ì
Income from continuing operations ÏÏÏÏÏÏÏÏ 423 52 912 (964) 423
Discontinued operations:
Loss from operations, net of taxes ÏÏÏÏÏÏÏ (1) (1) (1) 2 (1)
Net income ÏÏÏÏÏÏÏÏÏÏÏÏÏÏÏÏÏÏÏÏÏÏÏÏÏÏÏÏ $ 422 $ 51 $ 911 $(962) $ 422
F-52