Starwood 2005 Annual Report Download - page 23
Download and view the complete annual report
Please find page 23 of the 2005 Starwood annual report below. You can navigate through the pages in the report by either clicking on the pages listed below, or by using the keyword search tool below to find specific information within the annual report.-
 1
1 -
2
-
3
-
4
-
5
-
6
-
7
-
8
-
9
-
10
-
11
-
12
-
 13
13 -
 14
14 -
 15
15 -
 16
16 -
 17
17 -
 18
18 -
 19
19 -
 20
20 -
 21
21 -
 22
22 -
 23
23 -
 24
24 -
 25
25 -
 26
26 -
 27
27 -
 28
28 -
 29
29 -
 30
30 -
 31
31 -
 32
32 -
 33
33 -
34
-
35
-
36
-
37
-
38
-
39
-
40
-
41
-
42
-
43
-
44
-
45
-
46
-
47
-
48
-
49
-
50
-
51
-
52
-
53
-
54
-
55
-
56
-
57
-
58
-
59
-
60
-
61
-
62
-
63
-
64
-
65
-
66
-
67
-
68
-
69
-
70
-
71
-
72
-
73
-
74
-
75
-
76
-
77
-
78
-
79
-
80
-
81
-
82
-
83
-
84
-
85
-
86
-
87
-
88
-
89
-
90
-
91
-
92
-
93
-
94
-
95
-
96
-
97
-
98
-
99
-
100
-
101
-
102
-
103
-
104
-
105
-
106
-
107
-
108
-
109
-
110
-
111
-
112
-
113
-
114
-
115
-
116
-
117
-
118
-
119
-
120
-
121
-
122
-
123
-
124
-
125
-
126
-
127
-
128
-
129
-
130
-
131
-
132
-
133
 |
 |

facilities in order to remain competitive. For further information see Item 7. Management's Discussion and
Analysis of Financial Condition and Results of Operations Ì Liquidity and Capital Resources in this Joint
Annual Report.
Our hotel business included 845 owned, managed or franchised hotels with approximately 258,000 rooms
and our vacation ownership business included 19 vacation ownership resorts and residential properties at
December 31, 2005, predominantly under seven brands. All brands (other than the Four Points by Sheraton
and the newly announced aloft brands) represent full-service properties that range in amenities from luxury
hotels and resorts to more moderately priced hotels. We also lease three stand-alone Bliss Spas, two in New
York, New York and one in London, England and have opened three Bliss Spas in W Hotels. In addition, we
have opened three Remedπe Spas in St. Regis hotels.
The following table reÖects our hotel and vacation ownership properties, by brand:
Hotels VOI and Residential
Properties Rooms Properties Rooms
St. Regis and Luxury Collection ÏÏÏÏÏÏÏÏÏÏÏÏÏÏÏÏÏÏÏÏÏÏÏÏÏÏÏ 53 8,000 2 Ì
Sheraton ÏÏÏÏÏÏÏÏÏÏÏÏÏÏÏÏÏÏÏÏÏÏÏÏÏÏÏÏÏÏÏÏÏÏÏÏÏÏÏÏÏÏÏÏÏÏÏ 389 134,000 6 4,000
WestinÏÏÏÏÏÏÏÏÏÏÏÏÏÏÏÏÏÏÏÏÏÏÏÏÏÏÏÏÏÏÏÏÏÏÏÏÏÏÏÏÏÏÏÏÏÏÏÏÏ 121 51,000 7 2,000
WÏÏÏÏÏÏÏÏÏÏÏÏÏÏÏÏÏÏÏÏÏÏÏÏÏÏÏÏÏÏÏÏÏÏÏÏÏÏÏÏÏÏÏÏÏÏÏÏÏÏÏÏÏ 20 6,000 Ì Ì
Four PointsÏÏÏÏÏÏÏÏÏÏÏÏÏÏÏÏÏÏÏÏÏÏÏÏÏÏÏÏÏÏÏÏÏÏÏÏÏÏÏÏÏÏÏÏÏ 127 22,000 Ì Ì
Le Mπeridien ÏÏÏÏÏÏÏÏÏÏÏÏÏÏÏÏÏÏÏÏÏÏÏÏÏÏÏÏÏÏÏÏÏÏÏÏÏÏÏÏÏÏÏÏ 122 32,000 Ì Ì
Independent/Other ÏÏÏÏÏÏÏÏÏÏÏÏÏÏÏÏÏÏÏÏÏÏÏÏÏÏÏÏÏÏÏÏÏÏÏÏÏÏ 13 5,000 4 Ì
Total ÏÏÏÏÏÏÏÏÏÏÏÏÏÏÏÏÏÏÏÏÏÏÏÏÏÏÏÏÏÏÏÏÏÏÏÏÏÏÏÏÏÏÏÏÏÏÏÏÏÏ 845 258,000 19 6,000
Hotel Business
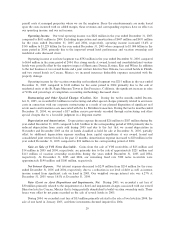
Owned, Leased and Consolidated Joint Venture Hotels. The following table summarizes revenue per
available room (""REVPAR'')(1), average daily rates (""ADR'') and average occupancy rates on a year-to-year
basis for our 119 owned, leased and consolidated joint venture hotels (excluding 12 hotels sold or closed and
11 hotels undergoing signiÑcant repositionings or without comparable results in 2005 and 2004) (""Same-Store
Owned Hotels'') for the years ended December 31, 2005 and 2004:
Year Ended
December 31,
2005 2004 Variance
Worldwide (119 hotels with approximately 44,000 rooms)
REVPAR ÏÏÏÏÏÏÏÏÏÏÏÏÏÏÏÏÏÏÏÏÏÏÏÏÏÏÏÏÏÏÏÏÏÏÏÏÏÏÏÏÏÏÏÏÏÏÏÏÏÏÏÏÏÏÏ $123.14 $111.01 10.9%
ADR ÏÏÏÏÏÏÏÏÏÏÏÏÏÏÏÏÏÏÏÏÏÏÏÏÏÏÏÏÏÏÏÏÏÏÏÏÏÏÏÏÏÏÏÏÏÏÏÏÏÏÏÏÏÏÏÏÏÏÏ $174.70 $162.50 7.5%
Occupancy ÏÏÏÏÏÏÏÏÏÏÏÏÏÏÏÏÏÏÏÏÏÏÏÏÏÏÏÏÏÏÏÏÏÏÏÏÏÏÏÏÏÏÏÏÏÏÏÏÏÏÏÏÏÏ 70.5% 68.3% 2.2
North America (78 hotels with approximately 32,000 rooms)
REVPAR ÏÏÏÏÏÏÏÏÏÏÏÏÏÏÏÏÏÏÏÏÏÏÏÏÏÏÏÏÏÏÏÏÏÏÏÏÏÏÏÏÏÏÏÏÏÏÏÏÏÏÏÏÏÏÏ $123.02 $110.13 11.7%
ADR ÏÏÏÏÏÏÏÏÏÏÏÏÏÏÏÏÏÏÏÏÏÏÏÏÏÏÏÏÏÏÏÏÏÏÏÏÏÏÏÏÏÏÏÏÏÏÏÏÏÏÏÏÏÏÏÏÏÏÏ $170.93 $156.62 9.1%
Occupancy ÏÏÏÏÏÏÏÏÏÏÏÏÏÏÏÏÏÏÏÏÏÏÏÏÏÏÏÏÏÏÏÏÏÏÏÏÏÏÏÏÏÏÏÏÏÏÏÏÏÏÏÏÏÏ 72.0% 70.3% 1.7
International (41 hotels with approximately 12,000 rooms)
REVPAR ÏÏÏÏÏÏÏÏÏÏÏÏÏÏÏÏÏÏÏÏÏÏÏÏÏÏÏÏÏÏÏÏÏÏÏÏÏÏÏÏÏÏÏÏÏÏÏÏÏÏÏÏÏÏÏ $123.48 $113.48 8.8%
ADR ÏÏÏÏÏÏÏÏÏÏÏÏÏÏÏÏÏÏÏÏÏÏÏÏÏÏÏÏÏÏÏÏÏÏÏÏÏÏÏÏÏÏÏÏÏÏÏÏÏÏÏÏÏÏÏÏÏÏÏ $186.30 $181.21 2.8%
Occupancy ÏÏÏÏÏÏÏÏÏÏÏÏÏÏÏÏÏÏÏÏÏÏÏÏÏÏÏÏÏÏÏÏÏÏÏÏÏÏÏÏÏÏÏÏÏÏÏÏÏÏÏÏÏÏ 66.3% 62.6% 3.7
(1) REVPAR is calculated by dividing room revenue, which is derived from rooms and suites rented or leased, by total room nights
available for a given period. REVPAR may not be comparable to similarly titled measures such as revenues.
19