Rite Aid 2016 Annual Report Download - page 99
Download and view the complete annual report
Please find page 99 of the 2016 Rite Aid annual report below. You can navigate through the pages in the report by either clicking on the pages listed below, or by using the keyword search tool below to find specific information within the annual report.-
 1
1 -
2
-
3
-
4
-
5
-
6
-
7
-
8
-
9
-
10
-
11
-
12
-
13
-
14
-
15
-
16
-
17
-
18
-
19
-
20
-
21
-
22
-
23
-
24
-
25
-
26
-
27
-
28
-
29
-
30
-
31
-
32
-
33
-
34
-
35
-
36
-
37
-
38
-
39
-
40
-
41
-
42
-
43
-
44
-
45
-
46
-
47
-
48
-
49
-
50
-
51
-
52
-
53
-
54
-
55
-
56
-
57
-
58
-
59
-
60
-
61
-
62
-
63
-
64
-
65
-
66
-
67
-
68
-
69
-
70
-
71
-
72
-
73
-
74
-
75
-
76
-
77
-
78
-
79
-
80
-
81
-
82
-
83
-
84
-
85
-
86
-
87
-
88
-
 89
89 -
 90
90 -
 91
91 -
 92
92 -
 93
93 -
 94
94 -
 95
95 -
 96
96 -
 97
97 -
 98
98 -
 99
99 -
 100
100 -
 101
101 -
 102
102 -
 103
103 -
 104
104 -
 105
105 -
 106
106 -
 107
107 -
 108
108 -
 109
109 -
110
-
111
-
112
-
113
-
114
-
115
-
116
-
117
-
118
-
119
-
120
-
121
-
122
-
123
-
124
-
125
-
126
-
127
-
128
-
129
-
130
-
131
-
132
-
133
-
134
-
135
-
136
-
137
-
138
-
139
-
140
-
141
-
142
-
143
-
144
-
145
-
146
-
147
-
148
-
149
-
150
-
151
-
152
-
153
-
154
-
155
-
156
-
157
-
158
-
159
-
160
-
161
-
162
-
163
-
164
-
165
 |
 |

RITE AID CORPORATION AND SUBSIDIARIES
NOTES TO CONSOLIDATED FINANCIAL STATEMENTS (Continued)
For the Years Ended February 27, 2016, February 28, 2015 and March 1, 2014
(In thousands, except per share amounts)
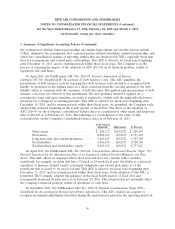
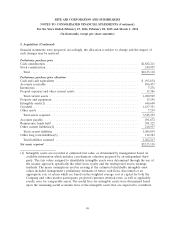
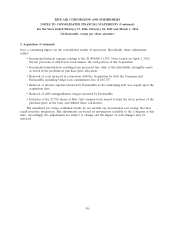
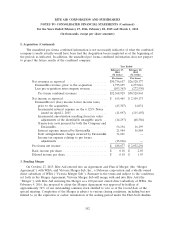
2. Acquisition (Continued)
financial statements were prepared. Accordingly, the allocation is subject to change and the impact of
such changes may be material.
Preliminary purchase price
Cash consideration .................................................... $1,882,211
Stock consideration .................................................... 240,907
Total ............................................................. $2,123,118
Preliminary purchase price allocation
Cash and cash equivalents ............................................... $ 103,834
Accounts receivable .................................................... 896,473
Inventories .......................................................... 7,276
Prepaid expenses and other current assets .................................... 13,386
Total current assets ................................................... 1,020,969
Property and equipment ................................................. 13,196
Intangible assets(1) .................................................... 646,600
Goodwill ............................................................ 1,637,351
Other assets ......................................................... 7,219
Total assets acquired .................................................. 3,325,335
Accounts payable ...................................................... 491,672
Reinsurance funds held ................................................. 381,225
Other current liabilities(2) ............................................... 216,937
Total current liabilities ................................................ 1,089,834
Other long term liabilities(3) ............................................. 112,383
Total liabilities assumed ............................................... 1,202,217
Net assets acquired ..................................................... $2,123,118
(1) Intangible assets are recorded at estimated fair value, as determined by management based on
available information which includes a preliminary valuation prepared by an independent third
party. The fair values assigned to identifiable intangible assets were determined through the use of
the income approach, specifically the relief from royalty and the multi-period excess earnings
methods. The major assumptions used in arriving at the estimated identifiable intangible asset
values included management’s preliminary estimates of future cash flows, discounted at an
appropriate rate of return which are based on the weighted average cost of capital for both the
Company and other market participants, projected customer attrition rates, as well as applicable
royalty rates for comparable assets. The useful lives for intangible assets were determined based
upon the remaining useful economic lives of the intangible assets that are expected to contribute
99