Rite Aid 2016 Annual Report Download - page 49
Download and view the complete annual report
Please find page 49 of the 2016 Rite Aid annual report below. You can navigate through the pages in the report by either clicking on the pages listed below, or by using the keyword search tool below to find specific information within the annual report.-
 1
1 -
2
-
3
-
4
-
5
-
6
-
7
-
8
-
9
-
10
-
11
-
12
-
13
-
14
-
15
-
16
-
17
-
18
-
19
-
20
-
21
-
22
-
23
-
24
-
25
-
26
-
27
-
28
-
29
-
30
-
31
-
32
-
33
-
34
-
35
-
36
-
37
-
38
-
 39
39 -
 40
40 -
 41
41 -
 42
42 -
 43
43 -
 44
44 -
 45
45 -
 46
46 -
 47
47 -
 48
48 -
 49
49 -
 50
50 -
 51
51 -
 52
52 -
 53
53 -
 54
54 -
 55
55 -
 56
56 -
 57
57 -
 58
58 -
 59
59 -
60
-
61
-
62
-
63
-
64
-
65
-
66
-
67
-
68
-
69
-
70
-
71
-
72
-
73
-
74
-
75
-
76
-
77
-
78
-
79
-
80
-
81
-
82
-
83
-
84
-
85
-
86
-
87
-
88
-
89
-
90
-
91
-
92
-
93
-
94
-
95
-
96
-
97
-
98
-
99
-
100
-
101
-
102
-
103
-
104
-
105
-
106
-
107
-
108
-
109
-
110
-
111
-
112
-
113
-
114
-
115
-
116
-
117
-
118
-
119
-
120
-
121
-
122
-
123
-
124
-
125
-
126
-
127
-
128
-
129
-
130
-
131
-
132
-
133
-
134
-
135
-
136
-
137
-
138
-
139
-
140
-
141
-
142
-
143
-
144
-
145
-
146
-
147
-
148
-
149
-
150
-
151
-
152
-
153
-
154
-
155
-
156
-
157
-
158
-
159
-
160
-
161
-
162
-
163
-
164
-
165
 |
 |
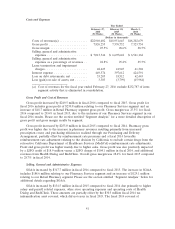
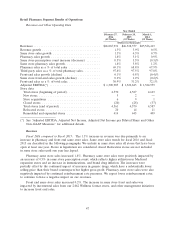
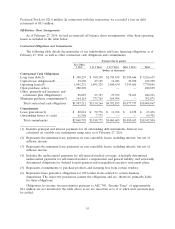
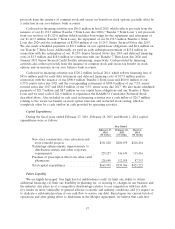
Front end gross profit was higher mainly due to higher sales. Gross profit was also positively impacted
by a LIFO credit of $18.9 million versus a LIFO charge of $104.1 million in fiscal 2014, and additional
revenues from Health Dialog and RediClinic. Overall gross margin was 28.6% for fiscal 2015 compared
to 28.7% in fiscal 2014.
We use the last-in, first-out (LIFO) method of inventory valuation, which is determined annually
when inflation rates and inventory levels are finalized. Therefore, LIFO costs for interim period
financial statements are estimated. The LIFO charge for fiscal 2016 was $11.2 million compared to a
LIFO credit of $18.9 million in fiscal 2015 and a LIFO charge of $104.1 million in fiscal 2014. The
LIFO charge for fiscal 2016 as compared to the LIFO credit in the prior year is due primarily to lower
deflation on pharmacy generics in fiscal 2016.
During fiscal 2015, we experienced higher generic deflation and lower pharmacy inventory in our
distribution centers resulting from our Purchasing and Delivery Arrangement than during fiscal 2014,
which contributed to a LIFO credit of $18.9 million.
During fiscal 2014, we experienced higher inflation on brand pharmacy products, which contributed
to overall inflation in fiscal 2014 and a LIFO charge of $104.1 million.
Selling, General and Administrative Expenses
SG&A as a percentage of revenue was 25.4% in fiscal 2016 compared to 25.2% in fiscal 2015, an
increase of $129.1 million. The increase in SG&A for fiscal 2016 was a result of increased payroll and
benefit costs, higher depreciation and amortization related to our increased capital spending, and
expenses relating to our acquisition of EnvisionRx and our pending Merger with WBA.
SG&A as a percentage of revenue was 25.2% in fiscal 2015 compared to 25.7% in fiscal 2014. The
decrease in SG&A as a percentage of revenues for fiscal 2015 was a result of leveraging the increase in
revenues and through various cost control initiatives. The increase in SG&A on a dollar basis of
$134.5 million in fiscal 2015 compared to fiscal 2014 is due primarily to higher salary and payroll
related expenses, other store operating expenses and operating costs of Health Dialog and RediClinic.
These amounts are partially offset by the $30.5 million fiscal 2014 tax indemnification asset reversal,
which did not recur in fiscal 2015. The fiscal 2014 reversal of $30.5 million of tax indemnification assets
resulted from our settlement with the IRS associated with a pre-acquisition Brooks Eckerd tax audit,
and was offset by an income tax benefit.
Pharmacy Services Segment Results of Operations
Acquisition of EnvisionRx
On June 24, 2015, we completed our acquisition of EnvisionRx, pursuant to the terms of the
agreement (‘‘Agreement’’) dated February 10, 2015. EnvisionRx, our new Pharmacy Services segment, is
a full-service pharmacy benefit provider. EnvisionRx provides both transparent and traditional
pharmacy benefit manager (‘‘PBM’’) options through its EnvisionRx and MedTrak PBMs, respectively.
EnvisionRx also offers fully integrated mail-order and specialty pharmacy services through Orchard
Pharmaceutical Services; access to the nation’s largest cash pay infertility discount drug program via
Design Rx; an innovative claims adjudication software platform in Laker Software; and a national
Medicare Part D prescription drug plan through EIC’s EnvisionRx Plus Silver product for the low
income auto-assign market and its Clear Choice product for the chooser market. EnvisionRx operates
as our 100 percent owned subsidiary. We believe that the acquisition of EnvisionRx enabled us to
expand our retail healthcare platform and enhance our health and wellness offerings by combining
EnvisionRx’s broad suite of PBM and pharmacy-related businesses with the our established retail
platform to provide our customers and patients with an integrated offering across retail, specialty and
mail-order channels.
49