Rite Aid 2016 Annual Report Download - page 140
Download and view the complete annual report
Please find page 140 of the 2016 Rite Aid annual report below. You can navigate through the pages in the report by either clicking on the pages listed below, or by using the keyword search tool below to find specific information within the annual report.-
 1
1 -
2
-
3
-
4
-
5
-
6
-
7
-
8
-
9
-
10
-
11
-
12
-
13
-
14
-
15
-
16
-
17
-
18
-
19
-
20
-
21
-
22
-
23
-
24
-
25
-
26
-
27
-
28
-
29
-
30
-
31
-
32
-
33
-
34
-
35
-
36
-
37
-
38
-
39
-
40
-
41
-
42
-
43
-
44
-
45
-
46
-
47
-
48
-
49
-
50
-
51
-
52
-
53
-
54
-
55
-
56
-
57
-
58
-
59
-
60
-
61
-
62
-
63
-
64
-
65
-
66
-
67
-
68
-
69
-
70
-
71
-
72
-
73
-
74
-
75
-
76
-
77
-
78
-
79
-
80
-
81
-
82
-
83
-
84
-
85
-
86
-
87
-
88
-
89
-
90
-
91
-
92
-
93
-
94
-
95
-
96
-
97
-
98
-
99
-
100
-
101
-
102
-
103
-
104
-
105
-
106
-
107
-
108
-
109
-
110
-
111
-
112
-
113
-
114
-
115
-
116
-
117
-
118
-
119
-
120
-
121
-
122
-
123
-
124
-
125
-
126
-
127
-
128
-
129
-
 130
130 -
 131
131 -
 132
132 -
 133
133 -
 134
134 -
 135
135 -
 136
136 -
 137
137 -
 138
138 -
 139
139 -
 140
140 -
 141
141 -
 142
142 -
 143
143 -
 144
144 -
 145
145 -
 146
146 -
 147
147 -
 148
148 -
 149
149 -
 150
150 -
151
-
152
-
153
-
154
-
155
-
156
-
157
-
158
-
159
-
160
-
161
-
162
-
163
-
164
-
165
 |
 |

RITE AID CORPORATION AND SUBSIDIARIES
NOTES TO CONSOLIDATED FINANCIAL STATEMENTS (Continued)
For the Years Ended February 27, 2016, February 28, 2015 and March 1, 2014
(In thousands, except per share amounts)
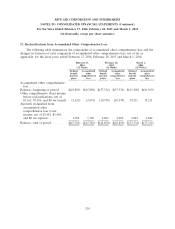
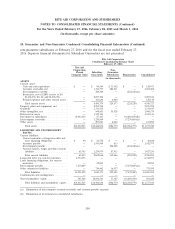
20. Segment Reporting (Continued)
respective segments. The CODM relies on internal management reporting that analyzes enterprise
results on certain key performance indicators, namely, revenues, gross profit, and Adjusted EBITDA.
The following table is a reconciliation of the Company’s business segments to the consolidated
financial statements for the fiscal years ended February 27, 2016, February 28, 2015 and March 1, 2014:
Retail Pharmacy Intersegment
Pharmacy Services Eliminations(1) Consolidated
February 27, 2016:
Revenues .......................... $26,865,931 $4,103,513 $(232,787) $30,736,657
Gross Profit ........................ 7,595,429 230,826 — 7,826,255
Adjusted EBITDA(2) ................. 1,300,905 101,357 — 1,402,262
February 28, 2015:
Revenues .......................... $26,528,377 $ — $ — $26,528,377
Gross Profit ........................ 7,576,732 — — 7,576,732
Adjusted EBITDA(2) ................. 1,322,843 — — 1,322,843
March 1, 2014:
Revenues .......................... $25,526,413 $ — $ — $25,526,413
Gross Profit ........................ 7,323,734 — — 7,323,734
Adjusted EBITDA(2) ................. 1,324,959 — — 1,324,959
(1) Intersegment eliminations include intersegment revenues and corresponding cost of revenues that
occur when Pharmacy Services segment customers use Retail Pharmacy segment stores to purchase
covered products. When this occurs, both the Retail Pharmacy and Pharmacy Services segments
record the revenue on a stand-alone basis.
(2) See ‘‘Adjusted EBITDA, Adjusted Net Income, Adjusted Net Income per Diluted Share and Other
Non-GAAP Measures’’ in MD&A for additional details.
140