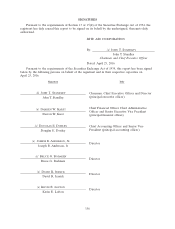
Rite Aid 2016 Annual Report Download - page 151
Download and view the complete annual report
Please find page 151 of the 2016 Rite Aid annual report below. You can navigate through the pages in the report by either clicking on the pages listed below, or by using the keyword search tool below to find specific information within the annual report.-
 1
1 -
2
-
3
-
4
-
5
-
6
-
7
-
8
-
9
-
10
-
11
-
12
-
13
-
14
-
15
-
16
-
17
-
18
-
19
-
20
-
21
-
22
-
23
-
24
-
25
-
26
-
27
-
28
-
29
-
30
-
31
-
32
-
33
-
34
-
35
-
36
-
37
-
38
-
39
-
40
-
41
-
42
-
43
-
44
-
45
-
46
-
47
-
48
-
49
-
50
-
51
-
52
-
53
-
54
-
55
-
56
-
57
-
58
-
59
-
60
-
61
-
62
-
63
-
64
-
65
-
66
-
67
-
68
-
69
-
70
-
71
-
72
-
73
-
74
-
75
-
76
-
77
-
78
-
79
-
80
-
81
-
82
-
83
-
84
-
85
-
86
-
87
-
88
-
89
-
90
-
91
-
92
-
93
-
94
-
95
-
96
-
97
-
98
-
99
-
100
-
101
-
102
-
103
-
104
-
105
-
106
-
107
-
108
-
109
-
110
-
111
-
112
-
113
-
114
-
115
-
116
-
117
-
118
-
119
-
120
-
121
-
122
-
123
-
124
-
125
-
126
-
127
-
128
-
129
-
130
-
131
-
132
-
133
-
134
-
135
-
136
-
137
-
138
-
139
-
140
-
 141
141 -
 142
142 -
 143
143 -
 144
144 -
 145
145 -
 146
146 -
 147
147 -
 148
148 -
 149
149 -
 150
150 -
 151
151 -
 152
152 -
 153
153 -
 154
154 -
 155
155 -
 156
156 -
 157
157 -
 158
158 -
 159
159 -
 160
160 -
 161
161 -
162
-
163
-
164
-
165
 |
 |

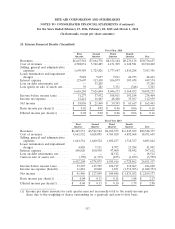
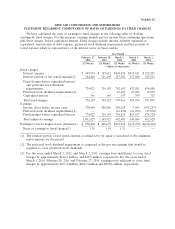
RITE AID CORPORATION AND SUBSIDIARIES
NOTES TO CONSOLIDATED FINANCIAL STATEMENTS (Continued)
For the Years Ended February 27, 2016, February 28, 2015 and March 1, 2014
(In thousands, except per share amounts)
24. Guarantor and Non-Guarantor Condensed Consolidating Financial Information (Continued)
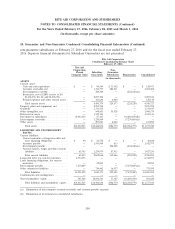
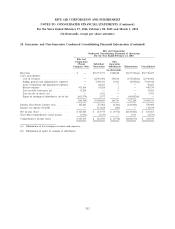
Rite Aid Corporation
Condensed Consolidating Statement of Operations
For the Year Ended February 27, 2016
Rite Aid
Corporation Non-
(Parent Subsidiary Guarantor
Company Only) Guarantors Subsidiaries Eliminations Consolidated
(in thousands)
Revenues ........................ $ — $30,731,771 $162,620 $(157,734)(a) $30,736,657
Costs and expenses:
Cost of revenues .................. — 22,910,402 154,838 (154,838)(a) 22,910,402
Selling, general and administrative expenses . — 7,004,321 11,921 (2,896)(a) 7,013,346
Lease termination and impairment expenses . — 48,423 — — 48,423
Interest expense .................. 415,304 34,268 2 — 449,574
Loss on debt retirement, net ........... 33,205 — — — 33,205
Loss on sale of assets, net ............ — 3,303 — — 3,303
Equity in earnings of subsidiaries, net of tax . (613,974) 3,972 — 610,002(b) —
(165,465) 30,004,689 166,761 452,268 30,458,253
Income (loss) before income taxes ........ 165,465 727,082 (4,141) (610,002) 278,404
Income tax expense (benefit) ............ — 113,108 (169) — 112,939
Net income (loss) ................... $165,465 $ 613,974 $ (3,972) $(610,002) $ 165,465
Total other comprehensive (loss) income .... (1,931) (1,931) — 1,931 (1,931)
Comprehensive income (loss) ............ $163,534 $ 612,043 $ (3,972) $(608,071) $ 163,534
(a) Elimination of intercompany revenues and expenses.
(b) Elimination of equity in earnings of subsidiaries.
151