Rite Aid 2016 Annual Report Download - page 41
Download and view the complete annual report
Please find page 41 of the 2016 Rite Aid annual report below. You can navigate through the pages in the report by either clicking on the pages listed below, or by using the keyword search tool below to find specific information within the annual report.-
 1
1 -
2
-
3
-
4
-
5
-
6
-
7
-
8
-
9
-
10
-
11
-
12
-
13
-
14
-
15
-
16
-
17
-
18
-
19
-
20
-
21
-
22
-
23
-
24
-
25
-
26
-
27
-
28
-
29
-
30
-
 31
31 -
 32
32 -
 33
33 -
 34
34 -
 35
35 -
 36
36 -
 37
37 -
 38
38 -
 39
39 -
 40
40 -
 41
41 -
 42
42 -
 43
43 -
 44
44 -
 45
45 -
 46
46 -
 47
47 -
 48
48 -
 49
49 -
 50
50 -
 51
51 -
52
-
53
-
54
-
55
-
56
-
57
-
58
-
59
-
60
-
61
-
62
-
63
-
64
-
65
-
66
-
67
-
68
-
69
-
70
-
71
-
72
-
73
-
74
-
75
-
76
-
77
-
78
-
79
-
80
-
81
-
82
-
83
-
84
-
85
-
86
-
87
-
88
-
89
-
90
-
91
-
92
-
93
-
94
-
95
-
96
-
97
-
98
-
99
-
100
-
101
-
102
-
103
-
104
-
105
-
106
-
107
-
108
-
109
-
110
-
111
-
112
-
113
-
114
-
115
-
116
-
117
-
118
-
119
-
120
-
121
-
122
-
123
-
124
-
125
-
126
-
127
-
128
-
129
-
130
-
131
-
132
-
133
-
134
-
135
-
136
-
137
-
138
-
139
-
140
-
141
-
142
-
143
-
144
-
145
-
146
-
147
-
148
-
149
-
150
-
151
-
152
-
153
-
154
-
155
-
156
-
157
-
158
-
159
-
160
-
161
-
162
-
163
-
164
-
165
 |
 |

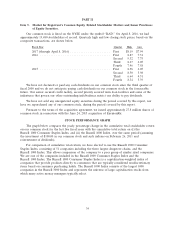
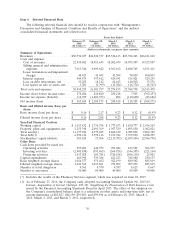
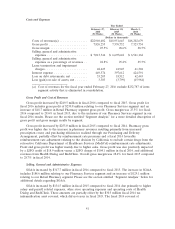
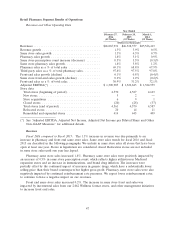
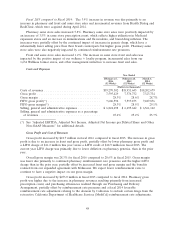
Costs and Expenses
Year Ended
February 27, February 28, March 1,
2016 2015 2014
(52 Weeks) (52 Weeks) (52 Weeks)
(Dollars in thousands)
Costs of revenues(a) ................ $22,910,402 $18,951,645 $18,202,679
Gross profit ...................... 7,826,255 7,576,732 7,323,734
Gross margin ..................... 25.5% 28.6% 28.7%
Selling, general and administrative
expenses ....................... $ 7,013,346 $ 6,695,642 $ 6,561,162
Selling, general and administrative
expenses as a percentage of revenues . . 22.8% 25.2% 25.7%
Lease termination and impairment
charges ........................ 48,423 41,945 41,304
Interest expense ................... 449,574 397,612 424,591
Loss on debt retirements, net ......... 33,205 18,512 62,443
Loss (gain) on sale of assets, net ....... 3,303 (3,799) (15,984)
(a) Cost of revenues for the fiscal year ended February 27, 2016 exclude $232,787 of inter-
segment activity that is eliminated in consolidation.
Gross Profit and Cost of Revenues
Gross profit increased by $249.5 million in fiscal 2016 compared to fiscal 2015. Gross profit for
fiscal 2016 includes gross profit of $230.8 million relating to our Pharmacy Services segment and an
increase of $18.7 million in Retail Pharmacy segment gross profit. Gross margin was 25.5% for fiscal
2016 compared to 28.6% in fiscal 2015, due to the inclusion of our Pharmacy Services segment in our
fiscal 2016 results. Please see the section entitled ‘‘Segment Analysis’’ for a more detailed description of
gross profit and gross margin results by segment.
Gross profit increased by $253.0 million in fiscal 2015 compared to fiscal 2014. Pharmacy gross
profit was higher due to the increase in pharmacy revenues resulting primarily from increased
prescription count, and purchasing efficiencies realized through our Purchasing and Delivery
Arrangement, partially offset by reimbursement rate pressures and a fiscal 2014 favorable
reimbursement rate adjustment relating to the decision by California to exclude certain drugs from the
retroactive California Department of Healthcare Services (MediCal) reimbursement rate adjustments.
Front end gross profit was higher mainly due to higher sales. Gross profit was also positively impacted
by a LIFO credit of $18.9 million versus a LIFO charge of $104.1 million in fiscal 2014, and additional
revenues from Health Dialog and RediClinic. Overall gross margin was 28.6% for fiscal 2015 compared
to 28.7% in fiscal 2014.
Selling, General and Administrative Expenses
SG&A increased by $317.7 million in fiscal 2016 compared to fiscal 2015. The increase in SG&A
includes $188.6 million relating to our Pharmacy Services segment and an increase of $129.1 million
relating to our Retail Pharmacy segment. Please see the section entitled ‘‘Segment Analysis’’ below for
additional details regarding SG&A.
SG&A increased by $134.5 million in fiscal 2015 compared to fiscal 2014 due primarily to higher
salary and payroll related expenses, other store operating expenses and operating costs of Health
Dialog and RediClinic. These amounts are partially offset by the $30.5 million fiscal 2014 tax
indemnification asset reversal, which did not recur in fiscal 2015. The fiscal 2014 reversal of
41