Rite Aid 2016 Annual Report Download - page 64
Download and view the complete annual report
Please find page 64 of the 2016 Rite Aid annual report below. You can navigate through the pages in the report by either clicking on the pages listed below, or by using the keyword search tool below to find specific information within the annual report.-
 1
1 -
2
-
3
-
4
-
5
-
6
-
7
-
8
-
9
-
10
-
11
-
12
-
13
-
14
-
15
-
16
-
17
-
18
-
19
-
20
-
21
-
22
-
23
-
24
-
25
-
26
-
27
-
28
-
29
-
30
-
31
-
32
-
33
-
34
-
35
-
36
-
37
-
38
-
39
-
40
-
41
-
42
-
43
-
44
-
45
-
46
-
47
-
48
-
49
-
50
-
51
-
52
-
53
-
 54
54 -
 55
55 -
 56
56 -
 57
57 -
 58
58 -
 59
59 -
 60
60 -
 61
61 -
 62
62 -
 63
63 -
 64
64 -
 65
65 -
 66
66 -
 67
67 -
 68
68 -
 69
69 -
 70
70 -
 71
71 -
 72
72 -
 73
73 -
 74
74 -
75
-
76
-
77
-
78
-
79
-
80
-
81
-
82
-
83
-
84
-
85
-
86
-
87
-
88
-
89
-
90
-
91
-
92
-
93
-
94
-
95
-
96
-
97
-
98
-
99
-
100
-
101
-
102
-
103
-
104
-
105
-
106
-
107
-
108
-
109
-
110
-
111
-
112
-
113
-
114
-
115
-
116
-
117
-
118
-
119
-
120
-
121
-
122
-
123
-
124
-
125
-
126
-
127
-
128
-
129
-
130
-
131
-
132
-
133
-
134
-
135
-
136
-
137
-
138
-
139
-
140
-
141
-
142
-
143
-
144
-
145
-
146
-
147
-
148
-
149
-
150
-
151
-
152
-
153
-
154
-
155
-
156
-
157
-
158
-
159
-
160
-
161
-
162
-
163
-
164
-
165
 |
 |

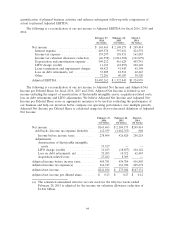
quantification of planned business activities and enhance subsequent follow-up with comparisons of
actual to planned Adjusted EBITDA.
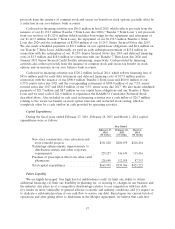
The following is a reconciliation of our net income to Adjusted EBITDA for fiscal 2016, 2015 and
2014:
February 27, February 28, March 1,
2016 2015 2014
(52 weeks) (52 weeks) (52 weeks)
Net income ......................... $ 165,465 $ 2,109,173 $ 249,414
Interest expense .................... 449,574 397,612 424,591
Income tax expense ................. 139,297 158,951 161,883
Income tax valuation allowance reduction . (26,358) (1,841,304) (161,079)
Depreciation and amortization expense . . . 509,212 416,628 403,741
LIFO charge (credit) ................ 11,163 (18,857) 104,142
Lease termination and impairment charges 48,423 41,945 41,304
Loss on debt retirements, net .......... 33,205 18,512 62,443
Other ........................... 72,281 40,183 38,520
Adjusted EBITDA .................... $1,402,262 $ 1,322,843 $1,324,959
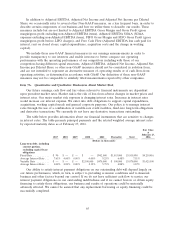
The following is a reconciliation of our net income to Adjusted Net Income and Adjusted Net
Income per Diluted Share for fiscal 2016, 2015 and 2014. Adjusted Net Income is defined as net
income excluding the impact of amortization of EnvisionRx intangible assets, acquisition-related costs,
loss on debt retirements and LIFO adjustments. We believe Adjusted Net Income and Adjusted Net
Income per Diluted Share serve as appropriate measures to be used in evaluating the performance of
our business and help our investors better compare our operating performance over multiple periods.
Adjusted Net Income per Diluted Share is calculated using our above-referenced definition of Adjusted
Net Income:
February 27, February 28, March 1,
2016 2015 2014
(52 weeks) (52 weeks) (52 weeks)
Net income .......................... $165,465 $ 2,109,173 $249,414
Add back—Income tax expense (benefit) . . . 112,939 (1,682,353) 804
Income before income taxes ........... 278,404 426,820 250,218
Adjustments:
Amortization of EnvisionRx intangible
assets .......................... 55,527 — —
LIFO charge (credit) ................ 11,163 (18,857) 104,142
Loss on debt retirements, net .......... 33,205 18,512 62,443
Acquisition-related costs .............. 27,482 8,309 —
Adjusted income before income taxes ....... 405,781 434,784 416,803
Adjusted income tax expense(a) ........... 164,747 161,740 269,672
Adjusted net income .................... $241,034 $ 273,044 $147,131
Adjusted net income per diluted share ....... $ 0.23 $ 0.27 $ 0.12
(a) The estimated annualized effective tax rate used for the fifty-two weeks ended
February 28, 2015 is adjusted for the income tax valuation allowance reduction of
$1.841 billion.
64