Rite Aid 2016 Annual Report Download - page 136
Download and view the complete annual report
Please find page 136 of the 2016 Rite Aid annual report below. You can navigate through the pages in the report by either clicking on the pages listed below, or by using the keyword search tool below to find specific information within the annual report.-
 1
1 -
2
-
3
-
4
-
5
-
6
-
7
-
8
-
9
-
10
-
11
-
12
-
13
-
14
-
15
-
16
-
17
-
18
-
19
-
20
-
21
-
22
-
23
-
24
-
25
-
26
-
27
-
28
-
29
-
30
-
31
-
32
-
33
-
34
-
35
-
36
-
37
-
38
-
39
-
40
-
41
-
42
-
43
-
44
-
45
-
46
-
47
-
48
-
49
-
50
-
51
-
52
-
53
-
54
-
55
-
56
-
57
-
58
-
59
-
60
-
61
-
62
-
63
-
64
-
65
-
66
-
67
-
68
-
69
-
70
-
71
-
72
-
73
-
74
-
75
-
76
-
77
-
78
-
79
-
80
-
81
-
82
-
83
-
84
-
85
-
86
-
87
-
88
-
89
-
90
-
91
-
92
-
93
-
94
-
95
-
96
-
97
-
98
-
99
-
100
-
101
-
102
-
103
-
104
-
105
-
106
-
107
-
108
-
109
-
110
-
111
-
112
-
113
-
114
-
115
-
116
-
117
-
118
-
119
-
120
-
121
-
122
-
123
-
124
-
125
-
 126
126 -
 127
127 -
 128
128 -
 129
129 -
 130
130 -
 131
131 -
 132
132 -
 133
133 -
 134
134 -
 135
135 -
 136
136 -
 137
137 -
 138
138 -
 139
139 -
 140
140 -
 141
141 -
 142
142 -
 143
143 -
 144
144 -
 145
145 -
 146
146 -
147
-
148
-
149
-
150
-
151
-
152
-
153
-
154
-
155
-
156
-
157
-
158
-
159
-
160
-
161
-
162
-
163
-
164
-
165
 |
 |

RITE AID CORPORATION AND SUBSIDIARIES
NOTES TO CONSOLIDATED FINANCIAL STATEMENTS (Continued)
For the Years Ended February 27, 2016, February 28, 2015 and March 1, 2014
(In thousands, except per share amounts)
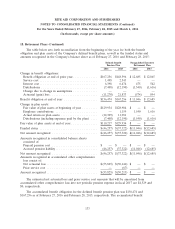
18. Retirement Plans (Continued)
The following table sets forth by level within the fair value hierarchy a summary of the plan’s
investments measured at fair value on a recurring basis as of February 27, 2016 and February 28, 2015:
Fair Value Measurements at February 27, 2016
Quoted Prices in
Active Markets Significant Significant
for Identical Observable Unobservable
Assets (Level 1) Inputs (Level 2) Inputs (Level 3) Total
Equity Securities
International equity ................. $— $ 14,414 $— $ 14,414
Large Cap ....................... — 28,188 — 28,188
Small-Mid Cap .................... — 11,684 — 11,684
Fixed Income
Long Term Credit Bond Index ......... — 43,130 — 43,130
20+ Year Treasury STRIPS ........... — 10,929 — 10,929
Intermediate Fixed Income ........... — 41 — 41
Other types of investments
Short Term Investments .............. — 1,831 — 1,831
Total ............................ $— $110,217 $— $110,217
Fair Value Measurements at February 28, 2015
Quoted Prices in
Active Markets Significant Significant
for Identical Observable Unobservable
Assets (Level 1) Inputs (Level 2) Inputs (Level 3) Total
Equity Securities
International equity ................. $— $ 17,071 $— $ 17,071
Large Cap ....................... — 35,524 — 35,524
Small-Mid Cap .................... — 15,977 — 15,977
Fixed Income
Long Term Credit Bond Index ......... — 47,249 — 47,249
Intermediate Fixed Income ........... — 13,612 — 13,612
Other types of investments
Short Term Investments .............. — 501 — 501
Total ............................ $— $129,934 $— $129,934
The following is a description of the valuation methodologies used for instruments measured at
fair value, as well as the general classification of such instruments pursuant to the valuation hierarchy.
Common and Collective Trusts
Common collective trust funds are stated at fair value as determined by the issuer of the common
collective trust funds based on the fair market value of the underlying investments.
136