Rite Aid 2016 Annual Report Download - page 39
Download and view the complete annual report
Please find page 39 of the 2016 Rite Aid annual report below. You can navigate through the pages in the report by either clicking on the pages listed below, or by using the keyword search tool below to find specific information within the annual report.-
 1
1 -
2
-
3
-
4
-
5
-
6
-
7
-
8
-
9
-
10
-
11
-
12
-
13
-
14
-
15
-
16
-
17
-
18
-
19
-
20
-
21
-
22
-
23
-
24
-
25
-
26
-
27
-
28
-
 29
29 -
 30
30 -
 31
31 -
 32
32 -
 33
33 -
 34
34 -
 35
35 -
 36
36 -
 37
37 -
 38
38 -
 39
39 -
 40
40 -
 41
41 -
 42
42 -
 43
43 -
 44
44 -
 45
45 -
 46
46 -
 47
47 -
 48
48 -
 49
49 -
50
-
51
-
52
-
53
-
54
-
55
-
56
-
57
-
58
-
59
-
60
-
61
-
62
-
63
-
64
-
65
-
66
-
67
-
68
-
69
-
70
-
71
-
72
-
73
-
74
-
75
-
76
-
77
-
78
-
79
-
80
-
81
-
82
-
83
-
84
-
85
-
86
-
87
-
88
-
89
-
90
-
91
-
92
-
93
-
94
-
95
-
96
-
97
-
98
-
99
-
100
-
101
-
102
-
103
-
104
-
105
-
106
-
107
-
108
-
109
-
110
-
111
-
112
-
113
-
114
-
115
-
116
-
117
-
118
-
119
-
120
-
121
-
122
-
123
-
124
-
125
-
126
-
127
-
128
-
129
-
130
-
131
-
132
-
133
-
134
-
135
-
136
-
137
-
138
-
139
-
140
-
141
-
142
-
143
-
144
-
145
-
146
-
147
-
148
-
149
-
150
-
151
-
152
-
153
-
154
-
155
-
156
-
157
-
158
-
159
-
160
-
161
-
162
-
163
-
164
-
165
 |
 |
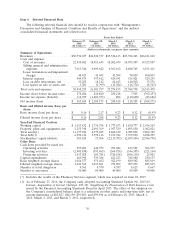
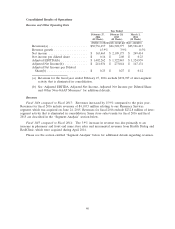
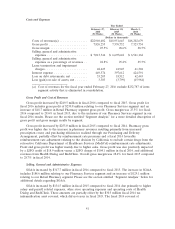
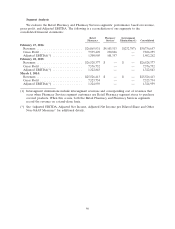
The increase in our Retail Pharmacy segment gross profit is due to an increase in front end gross profit
and pharmacy purchasing efficiencies and distribution savings realized through our Purchasing and
Delivery Arrangement with McKesson Corporation (‘‘McKesson’’), partially offset by lower pharmacy
reimbursement rates and a LIFO charge of $11.2 million this year versus a LIFO credit of $18.9 million
in fiscal 2015. The current year LIFO charge was higher due to lower deflation on generic drugs in
fiscal 2016.
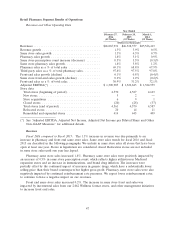
Selling, General and Administrative Expenses: Our selling, general and administrative expenses
(‘‘SG&A’’) decreased as a percentage of revenues in fiscal 2016 as a result of our Pharmacy Services
segment which has lower SG&A as a percent of revenues based on its business model. The increase on
a dollar basis in fiscal 2016 is due to increased payroll and benefit expenses, higher depreciation and
amortization related to EnvisionRx and our recent level of increased capital spending, and costs
relating to our acquisition of EnvisionRx and our pending merger with WBA.
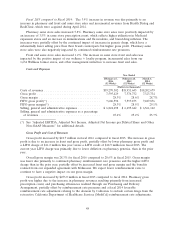
Lease Termination and Impairment Charges: We recorded lease terminations and impairment
charges of $48.4 million in fiscal 2016 compared to $41.9 million in fiscal 2015. Our charges have
remained consistent with the prior year due to similar financial results and similar levels of store
closure activity.
Debt Refinancing and Other Capital Transactions: During fiscal 2016 and fiscal 2015, we continued
to take steps to obtain more flexibility and reduce interest expense. During fiscal 2016 our operating
cash flow was approximately $1.0 billion, due to strong Adjusted EBITDA results combined with
contributions from working capital management. Working capital primarily benefited from a reduction
in store level pharmacy inventory. We used this operating cash flow to fund capital expenditures and to
reduce borrowings following the acquisition of EnvisionRx on June 24, 2015. While we were able to use
our working capital effectively during fiscal 2016, overall interest expense increased by $52.0 million
due to the 6.125% notes to fund the majority of the cash portion of our acquisition of EnvisionRx,
partially offset by various refinancing transactions as described in more detail in the ‘‘Liquidity and
Capital Resources’’ section below.
Income Tax: Net income for fiscal 2016 included income tax expense of $112.9 million, which
included a benefit of $26.4 million related to a reduction in valuation allowance primarily for an
increase in estimated utilization of state NOLs and for expiring carryforwards.
Income tax benefit for fiscal 2015 of $1,682.4 million was primarily the result of the reduction of
the valuation allowance against the net deferred tax assets of $1,841.3 million.
39