Rite Aid 2016 Annual Report Download - page 46
Download and view the complete annual report
Please find page 46 of the 2016 Rite Aid annual report below. You can navigate through the pages in the report by either clicking on the pages listed below, or by using the keyword search tool below to find specific information within the annual report.-
 1
1 -
2
-
3
-
4
-
5
-
6
-
7
-
8
-
9
-
10
-
11
-
12
-
13
-
14
-
15
-
16
-
17
-
18
-
19
-
20
-
21
-
22
-
23
-
24
-
25
-
26
-
27
-
28
-
29
-
30
-
31
-
32
-
33
-
34
-
35
-
 36
36 -
 37
37 -
 38
38 -
 39
39 -
 40
40 -
 41
41 -
 42
42 -
 43
43 -
 44
44 -
 45
45 -
 46
46 -
 47
47 -
 48
48 -
 49
49 -
 50
50 -
 51
51 -
 52
52 -
 53
53 -
 54
54 -
 55
55 -
 56
56 -
57
-
58
-
59
-
60
-
61
-
62
-
63
-
64
-
65
-
66
-
67
-
68
-
69
-
70
-
71
-
72
-
73
-
74
-
75
-
76
-
77
-
78
-
79
-
80
-
81
-
82
-
83
-
84
-
85
-
86
-
87
-
88
-
89
-
90
-
91
-
92
-
93
-
94
-
95
-
96
-
97
-
98
-
99
-
100
-
101
-
102
-
103
-
104
-
105
-
106
-
107
-
108
-
109
-
110
-
111
-
112
-
113
-
114
-
115
-
116
-
117
-
118
-
119
-
120
-
121
-
122
-
123
-
124
-
125
-
126
-
127
-
128
-
129
-
130
-
131
-
132
-
133
-
134
-
135
-
136
-
137
-
138
-
139
-
140
-
141
-
142
-
143
-
144
-
145
-
146
-
147
-
148
-
149
-
150
-
151
-
152
-
153
-
154
-
155
-
156
-
157
-
158
-
159
-
160
-
161
-
162
-
163
-
164
-
165
 |
 |

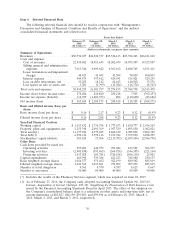
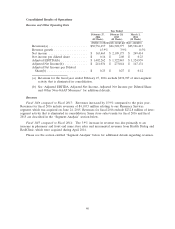
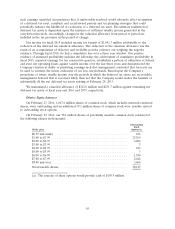
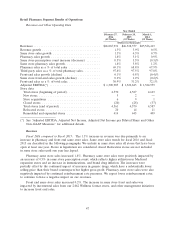
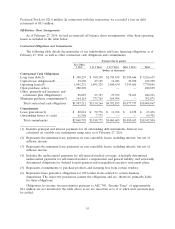
Segment Analysis
We evaluate the Retail Pharmacy and Pharmacy Services segments’ performance based on revenue,
gross profit, and Adjusted EBITDA. The following is a reconciliation of our segments to the
consolidated financial statements:
Retail Pharmacy Intersegment
Pharmacy Services Eliminations(1) Consolidated
February 27, 2016:
Revenues .......................... $26,865,931 $4,103,513 $(232,787) $30,736,657
Gross Profit ........................ 7,595,429 230,826 — 7,826,255
Adjusted EBITDA(*) ................. 1,300,905 101,357 — 1,402,262
February 28, 2015:
Revenues .......................... $26,528,377 $ — $ — $26,528,377
Gross Profit ........................ 7,576,732 — — 7,576,732
Adjusted EBITDA(*) ................. 1,322,843 — — 1,322,843
March 1, 2014:
Revenues .......................... $25,526,413 $ — $ — $25,526,413
Gross Profit ........................ 7,323,734 — — 7,323,734
Adjusted EBITDA(*) ................. 1,324,959 — — 1,324,959
(1) Intersegment eliminations include intersegment revenues and corresponding cost of revenues that
occur when Pharmacy Services segment customers use Retail Pharmacy segment stores to purchase
covered products. When this occurs, both the Retail Pharmacy and Pharmacy Services segments
record the revenue on a stand-alone basis.
(*) See ‘‘Adjusted EBITDA, Adjusted Net Income, Adjusted Net Income per Diluted Share and Other
Non-GAAP Measures’’ for additional details.
46