Rite Aid 2016 Annual Report Download - page 104
Download and view the complete annual report
Please find page 104 of the 2016 Rite Aid annual report below. You can navigate through the pages in the report by either clicking on the pages listed below, or by using the keyword search tool below to find specific information within the annual report.-
 1
1 -
2
-
3
-
4
-
5
-
6
-
7
-
8
-
9
-
10
-
11
-
12
-
13
-
14
-
15
-
16
-
17
-
18
-
19
-
20
-
21
-
22
-
23
-
24
-
25
-
26
-
27
-
28
-
29
-
30
-
31
-
32
-
33
-
34
-
35
-
36
-
37
-
38
-
39
-
40
-
41
-
42
-
43
-
44
-
45
-
46
-
47
-
48
-
49
-
50
-
51
-
52
-
53
-
54
-
55
-
56
-
57
-
58
-
59
-
60
-
61
-
62
-
63
-
64
-
65
-
66
-
67
-
68
-
69
-
70
-
71
-
72
-
73
-
74
-
75
-
76
-
77
-
78
-
79
-
80
-
81
-
82
-
83
-
84
-
85
-
86
-
87
-
88
-
89
-
90
-
91
-
92
-
93
-
 94
94 -
 95
95 -
 96
96 -
 97
97 -
 98
98 -
 99
99 -
 100
100 -
 101
101 -
 102
102 -
 103
103 -
 104
104 -
 105
105 -
 106
106 -
 107
107 -
 108
108 -
 109
109 -
 110
110 -
 111
111 -
 112
112 -
 113
113 -
 114
114 -
115
-
116
-
117
-
118
-
119
-
120
-
121
-
122
-
123
-
124
-
125
-
126
-
127
-
128
-
129
-
130
-
131
-
132
-
133
-
134
-
135
-
136
-
137
-
138
-
139
-
140
-
141
-
142
-
143
-
144
-
145
-
146
-
147
-
148
-
149
-
150
-
151
-
152
-
153
-
154
-
155
-
156
-
157
-
158
-
159
-
160
-
161
-
162
-
163
-
164
-
165
 |
 |

RITE AID CORPORATION AND SUBSIDIARIES
NOTES TO CONSOLIDATED FINANCIAL STATEMENTS (Continued)
For the Years Ended February 27, 2016, February 28, 2015 and March 1, 2014
(In thousands, except per share amounts)
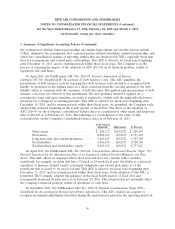
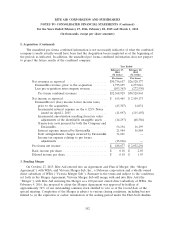
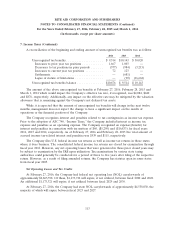
4. Income Per Share (Continued)
stock were exercised or converted into common stock or resulted in the issuance of common stock that
then shared in the income of the Company subject to anti- dilution limitations.
Year Ended
February 27, February 28, March 1,
2016 2015 2014
(52 Weeks) (52 Weeks) (52 Weeks)
Numerator for income per share:
Net income ......................... $ 165,465 $2,109,173 $249,414
Accretion of redeemable preferred stock . . . . — — (77)
Cumulative preferred stock dividends ...... — — (8,318)
Conversion of Series G and H preferred
stock ............................ — — (25,603)
Income attributable to common stockholders—
basic .............................. $ 165,465 $2,109,173 $215,416
Add back—interest on convertible notes ...... — 5,456 5,456
Income attributable to common stockholders—
diluted ............................ $ 165,465 $2,114,629 $220,872
Denominator:
Basic weighted average shares ........... 1,024,377 971,102 922,199
Outstanding options and restricted shares, net 17,985 21,967 32,093
Convertible notes ..................... — 24,792 24,800
Diluted weighted average shares .......... 1,042,362 1,017,861 979,092
Basic income per share ................ $ 0.16 $ 2.17 $ 0.23
Diluted income per share ............... $ 0.16 $ 2.08 $ 0.23
Due to their anti-dilutive effect, the following potential common shares have been excluded from
the computation of diluted income per share as of February 27, 2016, February 28, 2015 and March 1,
2014:
Year Ended
February 27, February 28, March 1,
2016 2015 2014
(52 Weeks) (52 Weeks) (52 Weeks)
Stock options ......................... 3,464 2,777 4,044
On September 30, 2013, the Company redeemed all of its outstanding Series G and Series H
Convertible Preferred Stock (collectively the ‘‘Convertible Preferred Stock’’) at the Company’s election.
The Convertible Preferred Stock was convertible into common stock of the Company, at the holder’s
option, at a conversion rate of $5.50 per share or 34,621,117 shares of common stock on September 30,
2013. The Convertible Preferred Stock was redeemable by the Company for cash at 105% of the
104