Rite Aid 2016 Annual Report Download - page 152
Download and view the complete annual report
Please find page 152 of the 2016 Rite Aid annual report below. You can navigate through the pages in the report by either clicking on the pages listed below, or by using the keyword search tool below to find specific information within the annual report.-
 1
1 -
2
-
3
-
4
-
5
-
6
-
7
-
8
-
9
-
10
-
11
-
12
-
13
-
14
-
15
-
16
-
17
-
18
-
19
-
20
-
21
-
22
-
23
-
24
-
25
-
26
-
27
-
28
-
29
-
30
-
31
-
32
-
33
-
34
-
35
-
36
-
37
-
38
-
39
-
40
-
41
-
42
-
43
-
44
-
45
-
46
-
47
-
48
-
49
-
50
-
51
-
52
-
53
-
54
-
55
-
56
-
57
-
58
-
59
-
60
-
61
-
62
-
63
-
64
-
65
-
66
-
67
-
68
-
69
-
70
-
71
-
72
-
73
-
74
-
75
-
76
-
77
-
78
-
79
-
80
-
81
-
82
-
83
-
84
-
85
-
86
-
87
-
88
-
89
-
90
-
91
-
92
-
93
-
94
-
95
-
96
-
97
-
98
-
99
-
100
-
101
-
102
-
103
-
104
-
105
-
106
-
107
-
108
-
109
-
110
-
111
-
112
-
113
-
114
-
115
-
116
-
117
-
118
-
119
-
120
-
121
-
122
-
123
-
124
-
125
-
126
-
127
-
128
-
129
-
130
-
131
-
132
-
133
-
134
-
135
-
136
-
137
-
138
-
139
-
140
-
141
-
 142
142 -
 143
143 -
 144
144 -
 145
145 -
 146
146 -
 147
147 -
 148
148 -
 149
149 -
 150
150 -
 151
151 -
 152
152 -
 153
153 -
 154
154 -
 155
155 -
 156
156 -
 157
157 -
 158
158 -
 159
159 -
 160
160 -
 161
161 -
 162
162 -
163
-
164
-
165
 |
 |

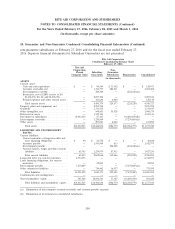
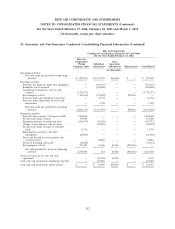
RITE AID CORPORATION AND SUBSIDIARIES
NOTES TO CONSOLIDATED FINANCIAL STATEMENTS (Continued)
For the Years Ended February 27, 2016, February 28, 2015 and March 1, 2014
(In thousands, except per share amounts)
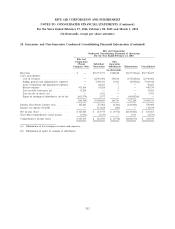
24. Guarantor and Non-Guarantor Condensed Consolidating Financial Information (Continued)
Rite Aid Corporation
Condensed Consolidating Statement of Cash Flows
For the Year Ended February 27, 2016
Rite Aid
Corporation Non-
(Parent Subsidiary Guarantor
Company Only) Guarantors Subsidiaries Eliminations Consolidated
(in thousands)
Operating activities:
Net cash (used in) provided by operating
activities .................... $ (387,871) $ 1,391,759 $(6,486) $ — $ 997,402
Investing activities:
Payments for property, plant and equipment . — (541,347) — — (541,347)
Intangible assets acquired ............ — (128,648) — — (128,648)
Acquisition of businesses, net of cash
acquired ...................... (1,778,377) — — — (1,778,377)
Intercompany activity ............... (103,834) (794,422) — 898,256 —
Proceeds from sale-leaseback transaction . . . — 36,732 — — 36,732
Proceeds from dispositions of assets and
investments .................... — 9,782 — — 9,782
Net cash (used in) provided by investing
activities .................... (1,882,211) (1,417,903) — 898,256 (2,401,858)
Financing activities:
Proceeds from issuance of long-term debt . . 1,800,000 — — — 1,800,000
Net proceeds from revolver ........... 375,000 — — — 375,000
Principal payments on long-term debt ..... (650,079) (22,638) — — (672,717)
Change in zero balance cash accounts ..... — (62,878) — — (62,878)
Net proceeds from issuance of common
stock ........................ 11,376 — — — 11,376
Financing fees paid for early debt
redemption .................... (26,003) — — — (26,003)
Excess tax benefit on stock options and
restricted stock .................. — 22,884 — — 22,884
Deferred financing costs paid .......... (34,634) — — — (34,634)
Intercompany activity ............... 794,422 63,446 40,388 (898,256) —
Net cash provided by (used in) financing
activities .................... 2,270,082 814 40,388 (898,256) 1,413,028
(Decrease) increase in cash and cash
equivalents ...................... — (25,330) 33,902 — 8,572
Cash and cash equivalents, beginning of period — 115,899 — — 115,899
Cash and cash equivalents, end of period .... $ — $ 90,569 $33,902 $ — $ 124,471
152