Rite Aid 2016 Annual Report Download - page 112
Download and view the complete annual report
Please find page 112 of the 2016 Rite Aid annual report below. You can navigate through the pages in the report by either clicking on the pages listed below, or by using the keyword search tool below to find specific information within the annual report.-
 1
1 -
2
-
3
-
4
-
5
-
6
-
7
-
8
-
9
-
10
-
11
-
12
-
13
-
14
-
15
-
16
-
17
-
18
-
19
-
20
-
21
-
22
-
23
-
24
-
25
-
26
-
27
-
28
-
29
-
30
-
31
-
32
-
33
-
34
-
35
-
36
-
37
-
38
-
39
-
40
-
41
-
42
-
43
-
44
-
45
-
46
-
47
-
48
-
49
-
50
-
51
-
52
-
53
-
54
-
55
-
56
-
57
-
58
-
59
-
60
-
61
-
62
-
63
-
64
-
65
-
66
-
67
-
68
-
69
-
70
-
71
-
72
-
73
-
74
-
75
-
76
-
77
-
78
-
79
-
80
-
81
-
82
-
83
-
84
-
85
-
86
-
87
-
88
-
89
-
90
-
91
-
92
-
93
-
94
-
95
-
96
-
97
-
98
-
99
-
100
-
101
-
 102
102 -
 103
103 -
 104
104 -
 105
105 -
 106
106 -
 107
107 -
 108
108 -
 109
109 -
 110
110 -
 111
111 -
 112
112 -
 113
113 -
 114
114 -
 115
115 -
 116
116 -
 117
117 -
 118
118 -
 119
119 -
 120
120 -
 121
121 -
 122
122 -
123
-
124
-
125
-
126
-
127
-
128
-
129
-
130
-
131
-
132
-
133
-
134
-
135
-
136
-
137
-
138
-
139
-
140
-
141
-
142
-
143
-
144
-
145
-
146
-
147
-
148
-
149
-
150
-
151
-
152
-
153
-
154
-
155
-
156
-
157
-
158
-
159
-
160
-
161
-
162
-
163
-
164
-
165
 |
 |

RITE AID CORPORATION AND SUBSIDIARIES
NOTES TO CONSOLIDATED FINANCIAL STATEMENTS (Continued)
For the Years Ended February 27, 2016, February 28, 2015 and March 1, 2014
(In thousands, except per share amounts)
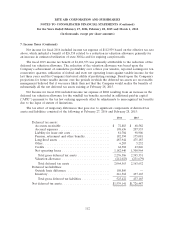
7. Income Taxes (Continued)
Net income for fiscal 2016 included income tax expense of $112,939 based on the effective tax rate
above, which included a benefit of $26,358 related to a reduction in valuation allowance primarily for
an increase in estimated utilization of state NOLs and for expiring carryforwards.
The fiscal 2015 income tax benefit of $1,682,353 was primarily attributable to the reduction of the
deferred tax valuation allowance. The reduction of the valuation allowance was based upon the
Company’s achievement of cumulative profitability over a three year window, reported earnings for ten
consecutive quarters, utilization of federal and state net operating losses against taxable income for the
last three years and the Company’s historical ability of predicting earnings. Based upon the Company’s
projections for future taxable income over the periods in which the deferred tax assets are recoverable,
management believed that it was more likely than not that the Company would realize the benefits of
substantially all the net deferred tax assets existing at February 28, 2015.
Net Income for fiscal 2014 included income tax expense of $804 resulting from an increase in the
deferred tax valuation allowance for the windfall tax benefits recorded in additional paid-in capital
(‘‘APIC’’) pursuant to the tax law ordering approach offset by adjustments to unrecognized tax benefits
due to the lapse of statute of limitations.
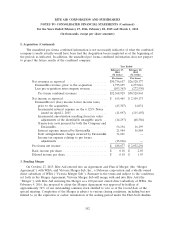
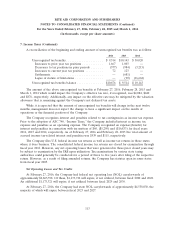
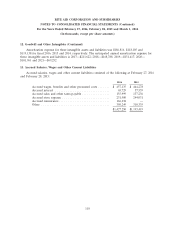
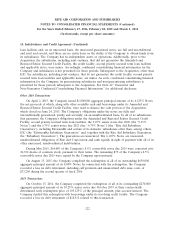
The tax effect of temporary differences that gave rise to significant components of deferred tax
assets and liabilities consisted of the following at February 27, 2016 and February 28, 2015:
2016 2015
Deferred tax assets:
Accounts receivable ........................... $ 72,883 $ 68,582
Accrued expenses ............................. 198,636 207,553
Liability for lease exit costs ...................... 81,704 98,906
Pension, retirement and other benefits .............. 182,394 175,081
Long-lived assets ............................. 487,944 475,187
Other ...................................... 6,203 5,232
Credits ..................................... 64,382 63,826
Net operating losses ........................... 1,182,440 1,300,964
Total gross deferred tax assets .................. 2,276,586 2,395,331
Valuation allowance ........................... (212,023) (231,679)
Total deferred tax assets ...................... 2,064,563 2,163,652
Deferred tax liabilities:
Outside basis difference ........................ 108,860 —
Inventory ................................... 416,562 437,165
Total gross deferred tax liabilities ................ 525,422 437,165
Net deferred tax assets ........................... $1,539,141 $1,726,487
112