Rite Aid 2016 Annual Report Download - page 40
Download and view the complete annual report
Please find page 40 of the 2016 Rite Aid annual report below. You can navigate through the pages in the report by either clicking on the pages listed below, or by using the keyword search tool below to find specific information within the annual report.-
 1
1 -
2
-
3
-
4
-
5
-
6
-
7
-
8
-
9
-
10
-
11
-
12
-
13
-
14
-
15
-
16
-
17
-
18
-
19
-
20
-
21
-
22
-
23
-
24
-
25
-
26
-
27
-
28
-
29
-
 30
30 -
 31
31 -
 32
32 -
 33
33 -
 34
34 -
 35
35 -
 36
36 -
 37
37 -
 38
38 -
 39
39 -
 40
40 -
 41
41 -
 42
42 -
 43
43 -
 44
44 -
 45
45 -
 46
46 -
 47
47 -
 48
48 -
 49
49 -
 50
50 -
51
-
52
-
53
-
54
-
55
-
56
-
57
-
58
-
59
-
60
-
61
-
62
-
63
-
64
-
65
-
66
-
67
-
68
-
69
-
70
-
71
-
72
-
73
-
74
-
75
-
76
-
77
-
78
-
79
-
80
-
81
-
82
-
83
-
84
-
85
-
86
-
87
-
88
-
89
-
90
-
91
-
92
-
93
-
94
-
95
-
96
-
97
-
98
-
99
-
100
-
101
-
102
-
103
-
104
-
105
-
106
-
107
-
108
-
109
-
110
-
111
-
112
-
113
-
114
-
115
-
116
-
117
-
118
-
119
-
120
-
121
-
122
-
123
-
124
-
125
-
126
-
127
-
128
-
129
-
130
-
131
-
132
-
133
-
134
-
135
-
136
-
137
-
138
-
139
-
140
-
141
-
142
-
143
-
144
-
145
-
146
-
147
-
148
-
149
-
150
-
151
-
152
-
153
-
154
-
155
-
156
-
157
-
158
-
159
-
160
-
161
-
162
-
163
-
164
-
165
 |
 |

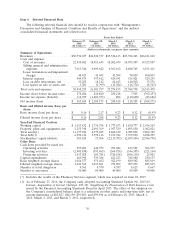
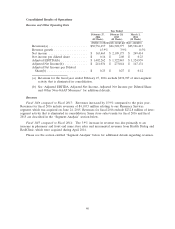
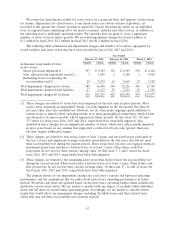
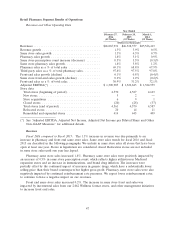
Consolidated Results of Operations
Revenue and Other Operating Data
Year Ended
February 27, February 28, March 1,
2016 2015 2014
(52 Weeks) (52 Weeks) (52 Weeks)
(Dollars in thousands except per share amounts)
Revenues(a) ...................... $30,736,657 $26,528,377 $25,526,413
Revenue growth ................... 15.9% 3.9% 0.5%
Net income ...................... $ 165,465 $ 2,109,173 $ 249,414
Net income per diluted share ......... $ 0.16 $ 2.08 $ 0.23
Adjusted EBITDA(b) ............... $ 1,402,262 $ 1,322,843 $ 1,324,959
Adjusted Net Income(b) ............. $ 241,034 $ 273,044 $ 147,131
Adjusted Net Income per Diluted
Share(b) ....................... $ 0.23 $ 0.27 $ 0.12
(a) Revenues for the fiscal year ended February 27, 2016 exclude $232,787 of inter-segment
activity that is eliminated in consolidation.
(b) See ‘‘Adjusted EBITDA, Adjusted Net Income, Adjusted Net Income per Diluted Share
and Other Non-GAAP Measures’’ for additional details.
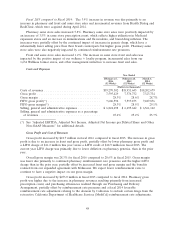
Revenues
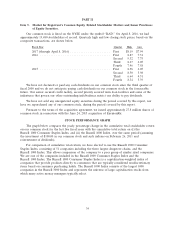
Fiscal 2016 compared to Fiscal 2015: Revenues increased by 15.9% compared to the prior year.
Revenues for fiscal 2016 include revenues of $4,103.5 million relating to our Pharmacy Services
segment, which was acquired on June 24, 2015. Revenues for fiscal 2016 exclude $232.8 million of inter-
segment activity that is eliminated in consolidation. Same store sales trends for fiscal 2016 and fiscal
2015 are described in the ‘‘Segment Analysis’’ section below.
Fiscal 2015 compared to Fiscal 2014: The 3.9% increase in revenue was due primarily to an
increase in pharmacy and front end same store sales and incremental revenues from Health Dialog and
RediClinic, which were acquired during April 2014.
Please see the section entitled ‘‘Segment Analysis’’ below for additional details regarding revenues.
40