Rite Aid 2016 Annual Report Download - page 36
Download and view the complete annual report
Please find page 36 of the 2016 Rite Aid annual report below. You can navigate through the pages in the report by either clicking on the pages listed below, or by using the keyword search tool below to find specific information within the annual report.-
 1
1 -
2
-
3
-
4
-
5
-
6
-
7
-
8
-
9
-
10
-
11
-
12
-
13
-
14
-
15
-
16
-
17
-
18
-
19
-
20
-
21
-
22
-
23
-
24
-
25
-
 26
26 -
 27
27 -
 28
28 -
 29
29 -
 30
30 -
 31
31 -
 32
32 -
 33
33 -
 34
34 -
 35
35 -
 36
36 -
 37
37 -
 38
38 -
 39
39 -
 40
40 -
 41
41 -
 42
42 -
 43
43 -
 44
44 -
 45
45 -
 46
46 -
47
-
48
-
49
-
50
-
51
-
52
-
53
-
54
-
55
-
56
-
57
-
58
-
59
-
60
-
61
-
62
-
63
-
64
-
65
-
66
-
67
-
68
-
69
-
70
-
71
-
72
-
73
-
74
-
75
-
76
-
77
-
78
-
79
-
80
-
81
-
82
-
83
-
84
-
85
-
86
-
87
-
88
-
89
-
90
-
91
-
92
-
93
-
94
-
95
-
96
-
97
-
98
-
99
-
100
-
101
-
102
-
103
-
104
-
105
-
106
-
107
-
108
-
109
-
110
-
111
-
112
-
113
-
114
-
115
-
116
-
117
-
118
-
119
-
120
-
121
-
122
-
123
-
124
-
125
-
126
-
127
-
128
-
129
-
130
-
131
-
132
-
133
-
134
-
135
-
136
-
137
-
138
-
139
-
140
-
141
-
142
-
143
-
144
-
145
-
146
-
147
-
148
-
149
-
150
-
151
-
152
-
153
-
154
-
155
-
156
-
157
-
158
-
159
-
160
-
161
-
162
-
163
-
164
-
165
 |
 |

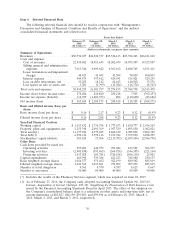
Item 6. Selected Financial Data
The following selected financial data should be read in conjunction with ‘‘Management’s
Discussion and Analysis of Financial Condition and Results of Operations’’ and the audited
consolidated financial statements and related notes.
Fiscal Year Ended
February 27, February 28, March 1, March 2, March 3,
2016 2015 2014 2013 2012
(52 weeks)(*) (52 weeks) (52 weeks) (52 weeks) (53 weeks)
(Dollars in thousands, except per share amounts)
Summary of Operations:
Revenues ..................... $30,736,657 $26,528,377 $25,526,413 $25,392,263 $26,121,222
Costs and expense:
Cost of revenues .............. 22,910,402 18,951,645 18,202,679 18,073,987 19,327,887
Selling, general and administrative
expenses .................. 7,013,346 6,695,642 6,561,162 6,600,765 6,531,411
Lease termination and impairment
charges ................... 48,423 41,945 41,304 70,859 100,053
Interest expense .............. 449,574 397,612 424,591 515,421 529,255
Loss on debt retirements, net ..... 33,205 18,512 62,443 140,502 33,576
Loss (gain) on sale of assets, net . . 3,303 (3,799) (15,984) (16,776) (8,703)
Total costs and expenses .......... 30,458,253 26,101,557 25,276,195 25,384,758 26,513,479
Income (loss) before income taxes . . . 278,404 426,820 250,218 7,505 (392,257)
Income tax expense (benefit) ....... 112,939 (1,682,353) 804 (110,600) (23,686)
Net income (loss) ............... $ 165,465 $ 2,109,173 $ 249,414 $ 118,105 $ (368,571)
Basic and diluted income (loss) per
share:
Basic income (loss) per share ...... $ 0.16 $ 2.17 $ 0.23 $ 0.12 $ (0.43)
Diluted income (loss) per share ..... $ 0.16 $ 2.08 $ 0.23 $ 0.12 $ (0.43)
Year-End Financial Position:
Working capital ................ $ 1,553,832 $ 1,736,758 $ 1,777,673 $ 1,830,777 $ 1,934,267
Property, plant and equipment, net . . 2,255,398 2,091,369 1,957,329 1,895,650 1,902,021
Total assets(1) ................. 11,277,010 8,777,425 6,860,672 6,985,038 7,264,385
Total debt(1) .................. 6,994,136 5,559,116 5,672,944 5,939,850 6,228,295
Stockholders’ equity (deficit) ....... 581,428 57,056 (2,113,702) (2,459,434) (2,586,756)
Other Data:
Cash flows provided by (used in):
Operating activities ............ 997,402 648,959 702,046 819,588 266,537
Investing activities ............. (2,401,858) (593,685) (364,924) (346,305) (221,169)
Financing activities ............ 1,413,028 (85,781) (320,168) (506,116) 25,801
Capital expenditures ............. 669,995 539,386 421,223 382,980 250,137
Basic weighted average shares ...... 1,024,377 971,102 922,199 889,562 885,819
Diluted weighted average shares .... 1,042,362 1,017,861 979,092 907,259 885,819
Number of retail drugstores ....... 4,561 4,570 4,587 4,623 4,667
Number of associates ............ 90,000 89,000 89,000 89,000 90,000
(*) Includes the results of the Pharmacy Services segment, which was acquired on June 24, 2015.
(1) As of February 27, 2016, the Company early adopted Accounting Standard Update No. 2015-03,
Interest—Imputation of Interest (Subtopic 835-30): Simplifying the Presentation of Debt Issuance Costs
issued by the Financial Accounting Standards Board in April 2015. The effect of the adoption on
the Company’s consolidated balance sheet is a reduction in other assets and long-term debt, net of
current maturities of $85,827, $84,199, $93,681, and $99,906 as of February 28, 2015, March 1,
2014, March 2, 2013, and March 3, 2012, respectively.
36