Rite Aid 2016 Annual Report Download - page 48
Download and view the complete annual report
Please find page 48 of the 2016 Rite Aid annual report below. You can navigate through the pages in the report by either clicking on the pages listed below, or by using the keyword search tool below to find specific information within the annual report.-
 1
1 -
2
-
3
-
4
-
5
-
6
-
7
-
8
-
9
-
10
-
11
-
12
-
13
-
14
-
15
-
16
-
17
-
18
-
19
-
20
-
21
-
22
-
23
-
24
-
25
-
26
-
27
-
28
-
29
-
30
-
31
-
32
-
33
-
34
-
35
-
36
-
37
-
 38
38 -
 39
39 -
 40
40 -
 41
41 -
 42
42 -
 43
43 -
 44
44 -
 45
45 -
 46
46 -
 47
47 -
 48
48 -
 49
49 -
 50
50 -
 51
51 -
 52
52 -
 53
53 -
 54
54 -
 55
55 -
 56
56 -
 57
57 -
 58
58 -
59
-
60
-
61
-
62
-
63
-
64
-
65
-
66
-
67
-
68
-
69
-
70
-
71
-
72
-
73
-
74
-
75
-
76
-
77
-
78
-
79
-
80
-
81
-
82
-
83
-
84
-
85
-
86
-
87
-
88
-
89
-
90
-
91
-
92
-
93
-
94
-
95
-
96
-
97
-
98
-
99
-
100
-
101
-
102
-
103
-
104
-
105
-
106
-
107
-
108
-
109
-
110
-
111
-
112
-
113
-
114
-
115
-
116
-
117
-
118
-
119
-
120
-
121
-
122
-
123
-
124
-
125
-
126
-
127
-
128
-
129
-
130
-
131
-
132
-
133
-
134
-
135
-
136
-
137
-
138
-
139
-
140
-
141
-
142
-
143
-
144
-
145
-
146
-
147
-
148
-
149
-
150
-
151
-
152
-
153
-
154
-
155
-
156
-
157
-
158
-
159
-
160
-
161
-
162
-
163
-
164
-
165
 |
 |

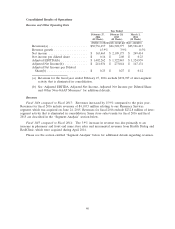
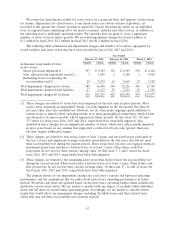
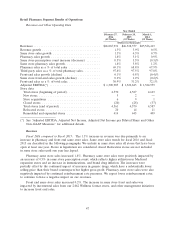
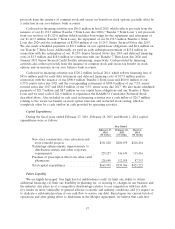
Fiscal 2015 compared to Fiscal 2014: The 3.9% increase in revenue was due primarily to an
increase in pharmacy and front end same store sales and incremental revenues from Health Dialog and
RediClinic, which were acquired during April 2014.
Pharmacy same store sales increased 5.8%. Pharmacy same store sales were positively impacted by
an increase of 3.5% in same store prescription count, which reflects higher utilization in Medicaid
expansion states and an increase in immunizations and flu incidents, and brand drug inflation. The
increases were partially offset by the continued impact of increases in generic drugs, which have a
substantially lower selling price than their brand counterparts but higher gross profit. Pharmacy same
store sales were also negatively impacted by continued reimbursement rate pressures.
Front end same store sales increased 1.2%. The increase in same store front end sales was
impacted by the positive impact of our wellness + loyalty program, incremental sales from our
1,634 Wellness format stores, and other management initiatives to increase front end sales.
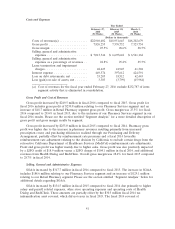
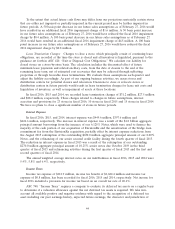
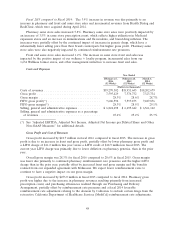
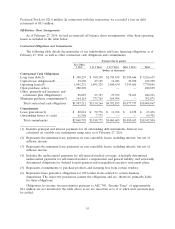
Costs and Expenses
Year Ended
February 27, February 28, March 1,
2016 2015 2014
(52 Weeks) (52 Weeks) (52 Weeks)
(Dollars in thousands)
Costs of revenues ................................ $19,270,502 $18,951,645 $18,202,679
Gross profit .................................... 7,595,429 7,576,732 7,323,734
Gross margin ................................... 28.3% 28.6% 28.7%
FIFO gross profit(*) .............................. 7,606,592 7,557,875 7,427,876
FIFO gross margin(*) ............................. 28.3% 28.5% 29.1%
Selling, general and administrative expenses ............. $ 6,824,698 $ 6,695,642 $ 6,561,162
Selling, general and administrative expenses as a percentage
of revenues ................................... 25.4% 25.2% 25.7%
(*) See ‘‘Adjusted EBITDA, Adjusted Net Income, Adjusted Net Income per Diluted Share and Other
Non-GAAP Measures’’ for additional details.
Gross Profit and Cost of Revenues
Gross profit increased by $18.7 million in fiscal 2016 compared to fiscal 2015. The increase in gross
profit is due to an increase in front end gross profit, partially offset by lower pharmacy gross profit and
a LIFO charge of $11.2 million this year versus a LIFO credit of $18.9 million in fiscal 2015. The
current year LIFO charge was primarily due to lower deflation on pharmacy generics, than in the prior
year.
Overall gross margin was 28.3% for fiscal 2016 compared to 28.6% in fiscal 2015. Gross margin
was lower due primarily to continued pharmacy reimbursement rate pressures and the higher LIFO
charge than in the prior year, partially offset by increased front end gross margin and the benefits
realized from our expanded agreement with McKesson. We expect lower reimbursement rates to
continue to have a negative impact on our gross margin.
Gross profit increased by $253.0 million in fiscal 2015 compared to fiscal 2014. Pharmacy gross
profit was higher due to the increase in pharmacy revenues resulting primarily from increased
prescription count, and purchasing efficiencies realized through our Purchasing and Delivery
Arrangement, partially offset by reimbursement rate pressures and a fiscal 2014 favorable
reimbursement rate adjustment relating to the decision by California to exclude certain drugs from the
retroactive California Department of Healthcare Services (MediCal) reimbursement rate adjustments.
48