Rite Aid 2016 Annual Report Download - page 129
Download and view the complete annual report
Please find page 129 of the 2016 Rite Aid annual report below. You can navigate through the pages in the report by either clicking on the pages listed below, or by using the keyword search tool below to find specific information within the annual report.-
 1
1 -
2
-
3
-
4
-
5
-
6
-
7
-
8
-
9
-
10
-
11
-
12
-
13
-
14
-
15
-
16
-
17
-
18
-
19
-
20
-
21
-
22
-
23
-
24
-
25
-
26
-
27
-
28
-
29
-
30
-
31
-
32
-
33
-
34
-
35
-
36
-
37
-
38
-
39
-
40
-
41
-
42
-
43
-
44
-
45
-
46
-
47
-
48
-
49
-
50
-
51
-
52
-
53
-
54
-
55
-
56
-
57
-
58
-
59
-
60
-
61
-
62
-
63
-
64
-
65
-
66
-
67
-
68
-
69
-
70
-
71
-
72
-
73
-
74
-
75
-
76
-
77
-
78
-
79
-
80
-
81
-
82
-
83
-
84
-
85
-
86
-
87
-
88
-
89
-
90
-
91
-
92
-
93
-
94
-
95
-
96
-
97
-
98
-
99
-
100
-
101
-
102
-
103
-
104
-
105
-
106
-
107
-
108
-
109
-
110
-
111
-
112
-
113
-
114
-
115
-
116
-
117
-
118
-
 119
119 -
 120
120 -
 121
121 -
 122
122 -
 123
123 -
 124
124 -
 125
125 -
 126
126 -
 127
127 -
 128
128 -
 129
129 -
 130
130 -
 131
131 -
 132
132 -
 133
133 -
 134
134 -
 135
135 -
 136
136 -
 137
137 -
 138
138 -
 139
139 -
140
-
141
-
142
-
143
-
144
-
145
-
146
-
147
-
148
-
149
-
150
-
151
-
152
-
153
-
154
-
155
-
156
-
157
-
158
-
159
-
160
-
161
-
162
-
163
-
164
-
165
 |
 |

RITE AID CORPORATION AND SUBSIDIARIES
NOTES TO CONSOLIDATED FINANCIAL STATEMENTS (Continued)
For the Years Ended February 27, 2016, February 28, 2015 and March 1, 2014
(In thousands, except per share amounts)
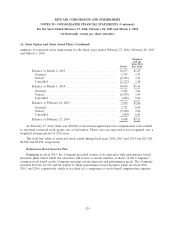
16. Stock Option and Stock Award Plans (Continued)
summary of restricted stock transactions for the fiscal years ended February 27, 2016, February 28, 2015
and March 1, 2014:
Weighted
Average
Grant Date
Shares Fair Value
Balance at March 2, 2013 ............................. 12,677 $1.25
Granted ........................................ 2,743 2.79
Vested ......................................... (4,152) 1.23
Cancelled ...................................... (1,212) 1.48
Balance at March 1, 2014 ............................. 10,056 $1.66
Granted ........................................ 3,303 7.01
Vested ......................................... (5,239) 1.54
Cancelled ...................................... (454) 5.00
Balance at February 28, 2015 .......................... 7,666 $3.84
Granted ........................................ 2,752 8.60
Vested ......................................... (5,140) 2.94
Cancelled ...................................... (420) 6.89
Balance at February 27, 2016 .......................... 4,858 $7.23
At February 27, 2016, there was $26,040 of total unrecognized pre-tax compensation costs related
to unvested restricted stock grants, net of forfeitures. These costs are expected to be recognized over a
weighted average period of 2.06 years.
The total fair value of restricted stock vested during fiscal years 2016, 2015 and 2014 was $15,104,
$8,090 and $5,098, respectively.
Performance Based Incentive Plan
Beginning in fiscal 2015, the Company provided certain of its associates with performance based
incentive plans under which the associates will receive a certain number of shares of the Company’s
common stock based on the Company meeting certain financial and performance goals. The Company
incurred $12,634, $1,769 and $0 related to these performance based incentive plans for fiscal 2016,
2015, and 2014, respectively, which is recorded as a component of stock-based compensation expense.
129