Rite Aid 2016 Annual Report Download - page 115
Download and view the complete annual report
Please find page 115 of the 2016 Rite Aid annual report below. You can navigate through the pages in the report by either clicking on the pages listed below, or by using the keyword search tool below to find specific information within the annual report.-
 1
1 -
2
-
3
-
4
-
5
-
6
-
7
-
8
-
9
-
10
-
11
-
12
-
13
-
14
-
15
-
16
-
17
-
18
-
19
-
20
-
21
-
22
-
23
-
24
-
25
-
26
-
27
-
28
-
29
-
30
-
31
-
32
-
33
-
34
-
35
-
36
-
37
-
38
-
39
-
40
-
41
-
42
-
43
-
44
-
45
-
46
-
47
-
48
-
49
-
50
-
51
-
52
-
53
-
54
-
55
-
56
-
57
-
58
-
59
-
60
-
61
-
62
-
63
-
64
-
65
-
66
-
67
-
68
-
69
-
70
-
71
-
72
-
73
-
74
-
75
-
76
-
77
-
78
-
79
-
80
-
81
-
82
-
83
-
84
-
85
-
86
-
87
-
88
-
89
-
90
-
91
-
92
-
93
-
94
-
95
-
96
-
97
-
98
-
99
-
100
-
101
-
102
-
103
-
104
-
 105
105 -
 106
106 -
 107
107 -
 108
108 -
 109
109 -
 110
110 -
 111
111 -
 112
112 -
 113
113 -
 114
114 -
 115
115 -
 116
116 -
 117
117 -
 118
118 -
 119
119 -
 120
120 -
 121
121 -
 122
122 -
 123
123 -
 124
124 -
 125
125 -
126
-
127
-
128
-
129
-
130
-
131
-
132
-
133
-
134
-
135
-
136
-
137
-
138
-
139
-
140
-
141
-
142
-
143
-
144
-
145
-
146
-
147
-
148
-
149
-
150
-
151
-
152
-
153
-
154
-
155
-
156
-
157
-
158
-
159
-
160
-
161
-
162
-
163
-
164
-
165
 |
 |

RITE AID CORPORATION AND SUBSIDIARIES
NOTES TO CONSOLIDATED FINANCIAL STATEMENTS (Continued)
For the Years Ended February 27, 2016, February 28, 2015 and March 1, 2014
(In thousands, except per share amounts)
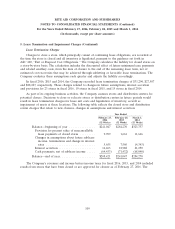
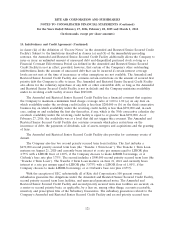
9. Medicare Part D (Continued)
The Company has recorded estimates of various assets and liabilities arising from its participation
in the Medicare Part D program based on information in its claims management and enrollment
systems. Significant estimates arising from its participation in this program include: (i) estimates of
low-income cost subsidies, reinsurance amounts, and coverage gap discount amounts ultimately payable
to CMS based on a detailed claims reconciliation that will occur in the following year; (ii) an estimate
of amounts receivable from CMS under a risk-sharing feature of the Medicare Part D program design,
referred to as the risk corridor and (iii) estimates for claims that have been reported and are in the
process of being paid or contested and for our estimate of claims that have been incurred but have not
yet been reported.
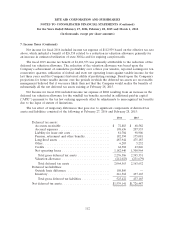
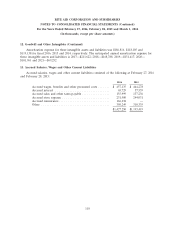
As of February 27, 2016, accounts receivable, net included $275,032 due from CMS and accrued
salaries, wages and other current liabilities included $166,238 of EIC liabilities under certain
reinsurance contracts. EIC limits its exposure to loss and recovers a portion of benefits paid by utilizing
quota-share reinsurance with a commercial reinsurance company.
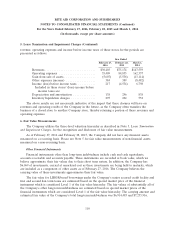
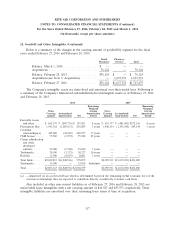
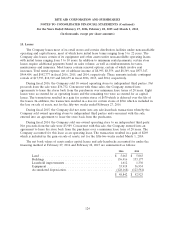
10. Inventory
At February 27, 2016 and February 28, 2015, inventories were $1,006,396 and $997,528,
respectively, lower than the amounts that would have been reported using the first-in, first-out
(‘‘FIFO’’) cost flow assumption. The Company calculates its FIFO inventory valuation using the retail
method for store inventories and the cost method for distribution facility inventories. The Company
recorded a LIFO charge for fiscal year 2016 of $11,163, compared to a LIFO credit of $18,857 for
fiscal year 2015 and a LIFO charge of $104,142 for fiscal year 2014. During fiscal 2016, 2015 and 2014,
a reduction in inventories related to working capital initiatives resulted in the liquidation of applicable
LIFO inventory quantities carried at lower costs in prior years. This LIFO liquidation resulted in a
$60,653, $38,867 and $13,894 cost of revenues decrease, with a corresponding reduction to the
adjustment to LIFO for fiscal 2016, fiscal 2015 and fiscal 2014, respectively.
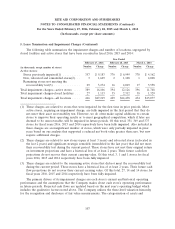
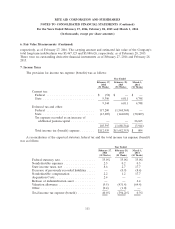
11. Property, Plant and Equipment
Following is a summary of property, plant and equipment, including capital lease assets, at
February 27, 2016 and February 28, 2015:
2016 2015
Land ...................................... $ 221,409 $ 232,785
Buildings ................................... 764,497 761,262
Leasehold improvements ........................ 2,245,307 2,078,974
Equipment .................................. 2,416,316 2,377,481
Software .................................... 6,111 —
Construction in progress ........................ 153,236 95,672
5,806,876 5,546,174
Accumulated depreciation ....................... (3,551,478) (3,454,805)
Property, plant and equipment, net ................. $2,255,398 $ 2,091,369
115