Rite Aid 2016 Annual Report Download - page 84
Download and view the complete annual report
Please find page 84 of the 2016 Rite Aid annual report below. You can navigate through the pages in the report by either clicking on the pages listed below, or by using the keyword search tool below to find specific information within the annual report.-
 1
1 -
2
-
3
-
4
-
5
-
6
-
7
-
8
-
9
-
10
-
11
-
12
-
13
-
14
-
15
-
16
-
17
-
18
-
19
-
20
-
21
-
22
-
23
-
24
-
25
-
26
-
27
-
28
-
29
-
30
-
31
-
32
-
33
-
34
-
35
-
36
-
37
-
38
-
39
-
40
-
41
-
42
-
43
-
44
-
45
-
46
-
47
-
48
-
49
-
50
-
51
-
52
-
53
-
54
-
55
-
56
-
57
-
58
-
59
-
60
-
61
-
62
-
63
-
64
-
65
-
66
-
67
-
68
-
69
-
70
-
71
-
72
-
73
-
 74
74 -
 75
75 -
 76
76 -
 77
77 -
 78
78 -
 79
79 -
 80
80 -
 81
81 -
 82
82 -
 83
83 -
 84
84 -
 85
85 -
 86
86 -
 87
87 -
 88
88 -
 89
89 -
 90
90 -
 91
91 -
 92
92 -
 93
93 -
 94
94 -
95
-
96
-
97
-
98
-
99
-
100
-
101
-
102
-
103
-
104
-
105
-
106
-
107
-
108
-
109
-
110
-
111
-
112
-
113
-
114
-
115
-
116
-
117
-
118
-
119
-
120
-
121
-
122
-
123
-
124
-
125
-
126
-
127
-
128
-
129
-
130
-
131
-
132
-
133
-
134
-
135
-
136
-
137
-
138
-
139
-
140
-
141
-
142
-
143
-
144
-
145
-
146
-
147
-
148
-
149
-
150
-
151
-
152
-
153
-
154
-
155
-
156
-
157
-
158
-
159
-
160
-
161
-
162
-
163
-
164
-
165
 |
 |

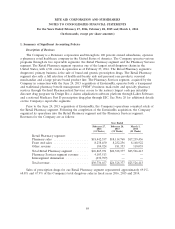
RITE AID CORPORATION AND SUBSIDIARIES
NOTES TO CONSOLIDATED FINANCIAL STATEMENTS
For the Years Ended February 27, 2016, February 28, 2015 and March 1, 2014
(In thousands, except per share amounts)
1. Summary of Significant Accounting Policies
Description of Business
The Company is a Delaware corporation and through its 100 percent owned subsidiaries, operates
a pharmacy retail healthcare company in the United States of America. The Company operates various
programs through its two reportable segments: the Retail Pharmacy segment and the Pharmacy Services
segment. The Retail Pharmacy segment operates one of the largest retail drugstore chains in the
United States, with 4,561 stores in operation as of February 27, 2016. The Retail Pharmacy segment’s
drugstores’ primary business is the sale of brand and generic prescription drugs. The Retail Pharmacy
segment also sells a full selection of health and beauty aids and personal care products, seasonal
merchandise and a large private brand product line. The Pharmacy Services segment, acquired by the
Company in connection with the June 24, 2015 acquisition of EnvisionRx, operates both a transparent
and traditional pharmacy benefit management (‘‘PBM’’) business; mail-order and specialty pharmacy
services through Orchard Pharmaceutical Services; access to the nation’s largest cash pay infertility
discount drug program via Design Rx; a claims adjudication software platform through Laker Software;
and a national Medicare Part D prescription drug plan through EIC. See Note 20 for additional details
on the Company’s reportable segments.
Prior to the June 24, 2015 acquisition of EnvisionRx, the Company’s operations consisted solely of
the Retail Pharmacy segment. Following the completion of the EnvisionRx acquisition, the Company
organized its operations into the Retail Pharmacy segment and the Pharmacy Services segment.
Revenues for the Company are as follows:
Year Ended
February 27, February 28, March 1,
2016 2015 2014
(52 Weeks) (52 Weeks) (52 Weeks)
Retail Pharmacy segment:
Pharmacy sales .................... $18,442,557 $18,114,768 $17,239,436
Front end sales .................... 8,238,450 8,232,256 8,168,922
Other revenue ..................... 184,924 181,353 118,055
Total Retail Pharmacy segment ......... $26,865,931 $26,528,377 $25,526,413
Pharmacy Services segment revenue ..... 4,103,513 — —
Intersegment elimination ............. (232,787) — —
Total revenue ...................... $30,736,657 $26,528,377 $25,526,413
Sales of prescription drugs for our Retail Pharmacy segment represented approximately 69.1%,
68.8% and 67.9% of the Company’s total drugstore sales in fiscal years 2016, 2015 and 2014,
84