Quest Diagnostics 2006 Annual Report Download - page 95
Download and view the complete annual report
Please find page 95 of the 2006 Quest Diagnostics annual report below. You can navigate through the pages in the report by either clicking on the pages listed below, or by using the keyword search tool below to find specific information within the annual report.-
 1
1 -
2
-
3
-
4
-
5
-
6
-
7
-
8
-
9
-
10
-
11
-
12
-
13
-
14
-
15
-
16
-
17
-
18
-
19
-
20
-
21
-
22
-
23
-
24
-
25
-
26
-
27
-
28
-
29
-
30
-
31
-
32
-
33
-
34
-
35
-
36
-
37
-
38
-
39
-
40
-
41
-
42
-
43
-
44
-
45
-
46
-
47
-
48
-
49
-
50
-
51
-
52
-
53
-
54
-
55
-
56
-
57
-
58
-
59
-
60
-
61
-
62
-
63
-
64
-
65
-
66
-
67
-
68
-
69
-
70
-
71
-
72
-
73
-
74
-
75
-
76
-
77
-
78
-
79
-
80
-
81
-
82
-
83
-
84
-
 85
85 -
 86
86 -
 87
87 -
 88
88 -
 89
89 -
 90
90 -
 91
91 -
 92
92 -
 93
93 -
 94
94 -
 95
95 -
 96
96 -
 97
97 -
 98
98 -
 99
99 -
 100
100 -
 101
101 -
 102
102 -
 103
103 -
 104
104 -
 105
105 -
106
-
107
-
108
-
109
-
110
-
111
-
112
-
113
-
114
-
115
-
116
-
117
-
118
-
119
-
120
-
121
-
122
-
123
-
124
-
125
-
126
-
127
-
128
-
129
-
130
-
131
 |
 |

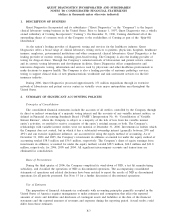
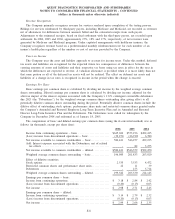
Revenue Recognition
The Company primarily recognizes revenue for services rendered upon completion of the testing process.
Billings for services reimbursed by third-party payers, including Medicare and Medicaid, are recorded as revenues
net of allowances for differences between amounts billed and the estimated receipts from such payers.
Adjustments to the estimated receipts, based on final settlement with the third-party payers, are recorded upon
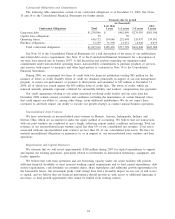
settlement. In 2006, 2005 and 2004, approximately 17%, 18% and 17%, respectively, of net revenues were
generated by Medicare and Medicaid programs. Under capitated arrangements with healthcare insurers, the
Company recognizes revenue based on a predetermined monthly reimbursement rate for each member of an
insurer’s health plan regardless of the number or cost of services provided by the Company.
Taxes on Income
The Company uses the asset and liability approach to account for income taxes. Under this method, deferred
tax assets and liabilities are recognized for the expected future tax consequences of differences between the
carrying amounts of assets and liabilities and their respective tax bases using tax rates in effect for the year in
which the differences are expected to reverse. A valuation allowance is provided when it is more likely than not
that some portion or all of the deferred tax assets will not be realized. The effect on deferred tax assets and
liabilities of a change in tax rates is recognized in income in the period when the change is enacted.
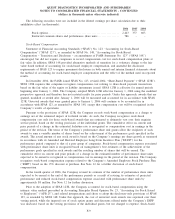
Earnings Per Share
Basic earnings per common share is calculated by dividing net income by the weighted average common
shares outstanding. Diluted earnings per common share is calculated by dividing net income, adjusted for the
after-tax impact of the interest expense associated with the Company’s 1
3
⁄
4
% contingent convertible debentures
due 2021 (the “Debentures”), by the weighted average common shares outstanding after giving effect to all
potentially dilutive common shares outstanding during the period. Potentially dilutive common shares include the
dilutive effect of outstanding stock options, performance share units and restricted common shares granted under
the Company’s Amended and Restated Employee Long-Term Incentive Plan and its Amended and Restated
Director Long-Term Incentive Plan and the Debentures. The Debentures were called for redemption by the
Company in December 2004 and redeemed as of January 18, 2005.
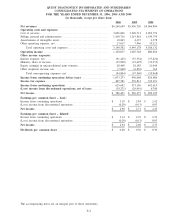
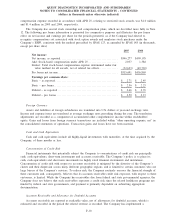
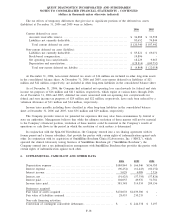
The computation of basic and diluted earnings per common share (using the if-converted method) was as
follows (in thousands, except per share data):
2006 2005 2004
Income from continuing operations – basic ......................... $625,692 $573,196 $492,415
(Loss) income from discontinued operations – basic ................. (39,271) (26,919) 6,780
Net income available to common stockholders – basic............... 586,421 546,277 499,195
Add: Interest expense associated with the Debentures, net of related
tax effects ...................................................... - 82 3,275
Net income available to common stockholders – diluted . . . .......... $586,421 $546,359 $502,470
Weighted average common shares outstanding – basic ............... 196,985 201,833 203,920
Effect of dilutive securities:
Stock options...................................................... 2,535 3,533 4,472
Restricted common shares and performance share units .............. 22 11 39
Debentures ........................................................ - 153 5,714
Weighted average common shares outstanding – diluted . . . .......... 199,542 205,530 214,145
Earnings per common share – basic:
Income from continuing operations ................................. $ 3.18 $ 2.84 $ 2.42
(Loss) income from discontinued operations......................... (0.20) (0.13) 0.03
Net income ....................................................... $ 2.98 $ 2.71 $ 2.45
Earnings per common share – diluted:
Income from continuing operations ................................. $ 3.14 $ 2.79 $ 2.32
(Loss) income from discontinued operations......................... (0.20) (0.13) 0.03
Net income ....................................................... $ 2.94 $ 2.66 $ 2.35
F-8
QUEST DIAGNOSTICS INCORPORATED AND SUBSIDIARIES
NOTES TO CONSOLIDATED FINANCIAL STATEMENTS - CONTINUED
(dollars in thousands unless otherwise indicated)