Quest Diagnostics 2006 Annual Report Download - page 83
Download and view the complete annual report
Please find page 83 of the 2006 Quest Diagnostics annual report below. You can navigate through the pages in the report by either clicking on the pages listed below, or by using the keyword search tool below to find specific information within the annual report.-
 1
1 -
2
-
3
-
4
-
5
-
6
-
7
-
8
-
9
-
10
-
11
-
12
-
13
-
14
-
15
-
16
-
17
-
18
-
19
-
20
-
21
-
22
-
23
-
24
-
25
-
26
-
27
-
28
-
29
-
30
-
31
-
32
-
33
-
34
-
35
-
36
-
37
-
38
-
39
-
40
-
41
-
42
-
43
-
44
-
45
-
46
-
47
-
48
-
49
-
50
-
51
-
52
-
53
-
54
-
55
-
56
-
57
-
58
-
59
-
60
-
61
-
62
-
63
-
64
-
65
-
66
-
67
-
68
-
69
-
70
-
71
-
72
-
 73
73 -
 74
74 -
 75
75 -
 76
76 -
 77
77 -
 78
78 -
 79
79 -
 80
80 -
 81
81 -
 82
82 -
 83
83 -
 84
84 -
 85
85 -
 86
86 -
 87
87 -
 88
88 -
 89
89 -
 90
90 -
 91
91 -
 92
92 -
 93
93 -
94
-
95
-
96
-
97
-
98
-
99
-
100
-
101
-
102
-
103
-
104
-
105
-
106
-
107
-
108
-
109
-
110
-
111
-
112
-
113
-
114
-
115
-
116
-
117
-
118
-
119
-
120
-
121
-
122
-
123
-
124
-
125
-
126
-
127
-
128
-
129
-
130
-
131
 |
 |
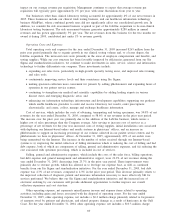
At both December 31, 2006 and 2005, the fair value of our debt was estimated at approximately $1.6
billion, using quoted market prices and yields for the same or similar types of borrowings, taking into account
the underlying terms of the debt instruments. At December 31, 2006 and 2005, the estimated fair value exceeded
the carrying value of the debt by approximately $0.4 million and $39 million, respectively. A hypothetical 10%
increase in interest rates (representing approximately 59 basis points at both December 31, 2006 and 2005) would
potentially reduce the estimated fair value of our debt by approximately $33 million and $36 million at
December 31, 2006 and 2005, respectively.
Borrowings under our senior unsecured revolving credit facility, our secured receivables credit facility and
our term loan due December 2008, are subject to variable interest rates. Interest on our secured receivables credit
facility is based on rates that are intended to approximate commercial paper rates for highly rated issuers. Interest
rates on our senior unsecured revolving credit facility and term loan due December 2008 are subject to a pricing
schedule that can fluctuate based on changes in our credit ratings. As such, our borrowing cost under these credit
arrangements will be subject to both fluctuations in interest rates and changes in our credit ratings. As of
December 31, 2006, our borrowing rate for our senior unsecured revolving credit facility and for our term loan
was LIBOR plus 0.50%. At December 31, 2006, the LIBOR rate was 5.35%. At December 31, 2006, there was
$75 million of borrowings outstanding under our term loan due December 2008, $300 million outstanding under
our secured receivables credit facility and no borrowings outstanding under our $500 million senior unsecured
revolving credit facility. Based on our net exposure to interest rate changes, a hypothetical 10% change in
interest rates on our variable rate indebtedness (representing approximately 54 basis points) would impact annual
net interest expense by approximately $2 million, assuming no changes to the debt outstanding at December 31,
2006. See Note 10 to the Consolidated Financial Statements for details regarding our debt outstanding.
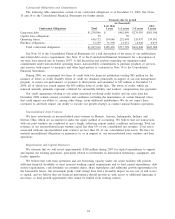
Risk Associated with Investment Portfolio
Our investment portfolio includes equity investments in publicly held companies that are classified as
available-for-sale securities and other strategic equity holdings in privately held companies. These securities are
exposed to price fluctuations and are generally concentrated in the life sciences industry. The carrying values of
our available-for-sale equity securities and privately held securities were $23 million at December 31, 2006.
We do not hedge our equity price risk. The impact of an adverse movement in equity prices on our holdings
in privately held companies is difficult to estimate, as our ability to realize returns on investments depends on,
among other things, the enterprises’ ability to raise additional capital or derive cash inflows from continuing
operations or through liquidity events such as initial public offerings, mergers or private sales.
Liquidity and Capital Resources
Cash and Cash Equivalents
Cash and cash equivalents at December 31, 2006 totaled $150 million, compared to $92 million at
December 31, 2005. Cash flows from operating activities in 2006 were $952 million, which were used to fund
investing activities of $414 million and financing activities of $480 million. Cash and cash equivalents at
December 31, 2005 totaled $92 million, compared to $73 million at December 31, 2004. Cash flows from
operating activities in 2005 provided cash of $852 million, which together with cash flows from financing
activities of $247 million, were used to fund investing activities of $1.1 billion.
Cash Flows from Operating Activities
Net cash provided by operating activities for 2006 was $952 million compared to $852 million in the prior
year period. This increase was primarily due to improved operating performance and the timing of various
payments for taxes and accrued expenses partially offset by an increase in accounts receivable. Days sales
outstanding, a measure of billing and collection efficiency, were 48 days at December 31, 2006 compared to 46
days at December 31, 2005.
Net cash provided by operating activities for 2005 was $852 million compared to $799 million in the prior
year period. This increase was primarily due to improved operating performance and a smaller increase in net
accounts receivable compared to the prior year, partially offset by the timing and net amount of various payments
for taxes. Days sales outstanding was 46 days at December 31, 2005 compared to 47 days at December 31, 2004.
62