Quest Diagnostics 2006 Annual Report Download - page 2
Download and view the complete annual report
Please find page 2 of the 2006 Quest Diagnostics annual report below. You can navigate through the pages in the report by either clicking on the pages listed below, or by using the keyword search tool below to find specific information within the annual report.-
 1
1 -
 2
2 -
 3
3 -
 4
4 -
 5
5 -
 6
6 -
 7
7 -
 8
8 -
 9
9 -
 10
10 -
 11
11 -
 12
12 -
 13
13 -
14
-
15
-
16
-
17
-
18
-
19
-
20
-
21
-
22
-
23
-
24
-
25
-
26
-
27
-
28
-
29
-
30
-
31
-
32
-
33
-
34
-
35
-
36
-
37
-
38
-
39
-
40
-
41
-
42
-
43
-
44
-
45
-
46
-
47
-
48
-
49
-
50
-
51
-
52
-
53
-
54
-
55
-
56
-
57
-
58
-
59
-
60
-
61
-
62
-
63
-
64
-
65
-
66
-
67
-
68
-
69
-
70
-
71
-
72
-
73
-
74
-
75
-
76
-
77
-
78
-
79
-
80
-
81
-
82
-
83
-
84
-
85
-
86
-
87
-
88
-
89
-
90
-
91
-
92
-
93
-
94
-
95
-
96
-
97
-
98
-
99
-
100
-
101
-
102
-
103
-
104
-
105
-
106
-
107
-
108
-
109
-
110
-
111
-
112
-
113
-
114
-
115
-
116
-
117
-
118
-
119
-
120
-
121
-
122
-
123
-
124
-
125
-
126
-
127
-
128
-
129
-
130
-
131
 |
 |
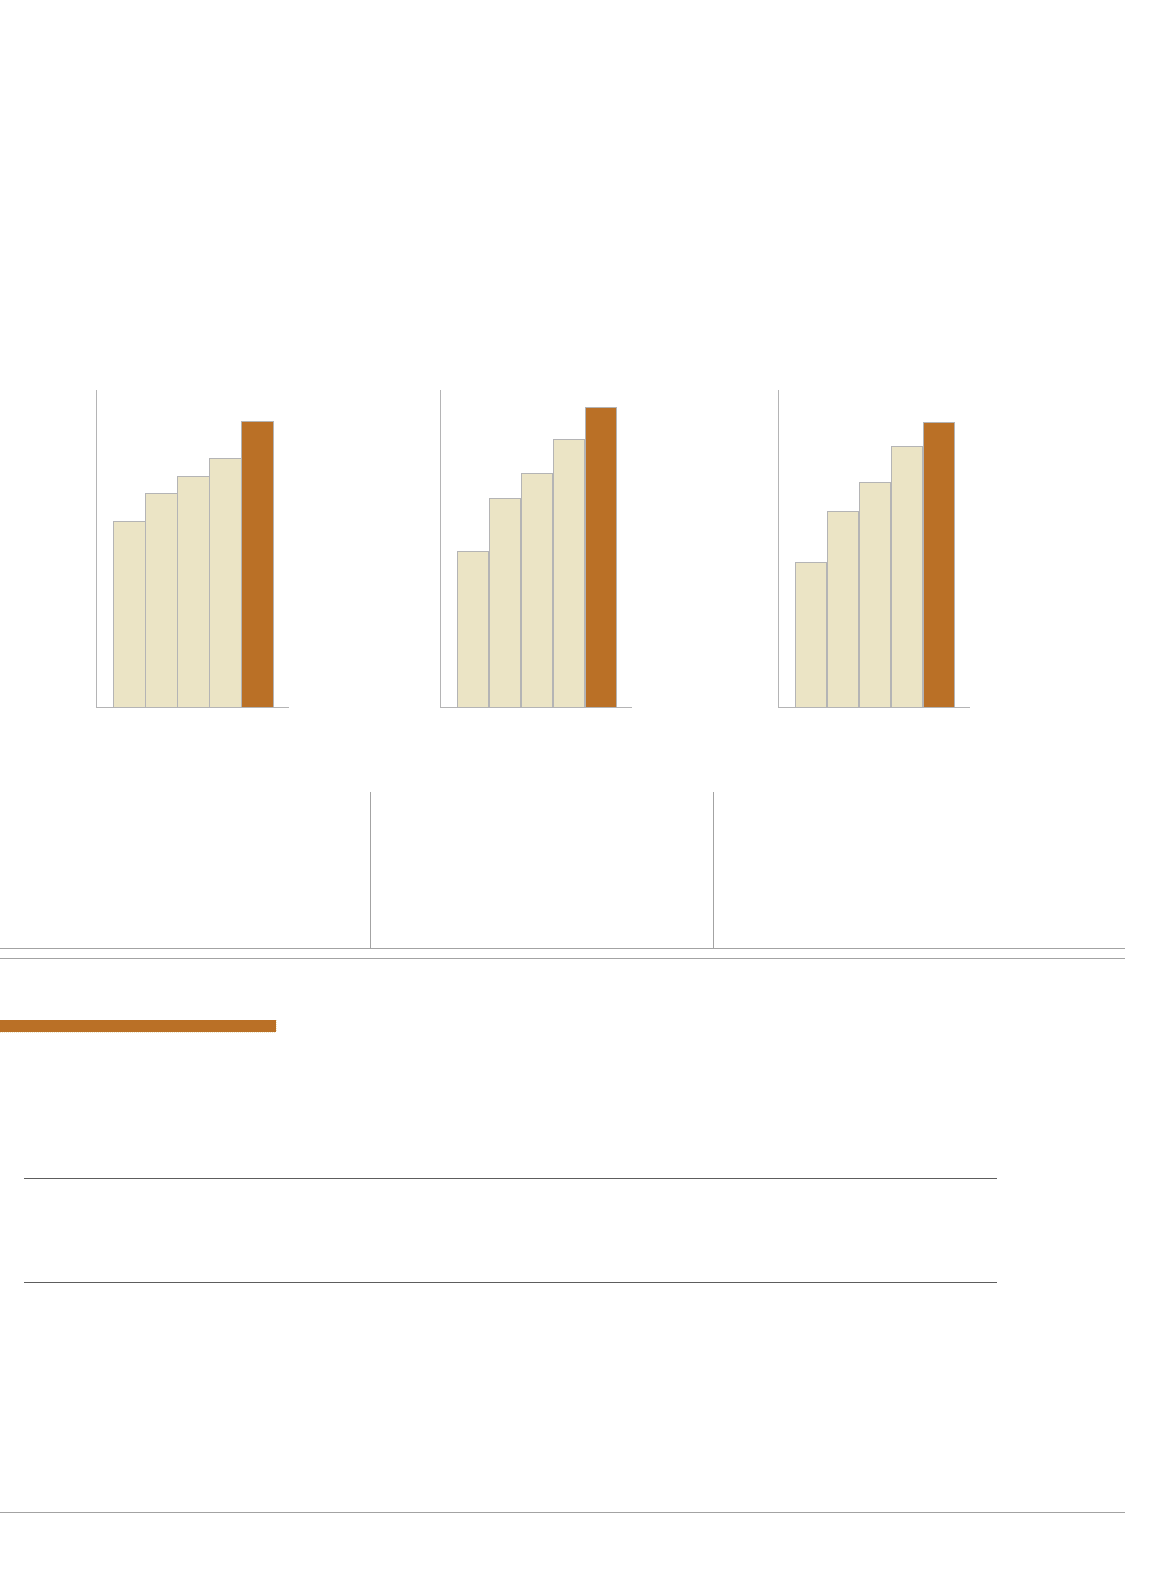
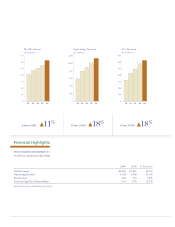
02 03 04 05 06
Net Revenues
($ billions)
02 03 04 05 06
Operating Income
($ millions)
02 03 04 05 06
Net Income
($ millions)
0
1000
2000
3000
4000
5000
6000
7000
0
200
400
600
800
1000
1200
0
100
200
300
400
500
600
700
0
1.0
2.0
3.0
4.0
5.0
6.0
7.0
0
200
400
600
800
1,000
1,200
0
100
200
300
400
500
600
700
11%
5-YearCAGR 18%
5-YearCAGR 18%
5-YearCAGR
2006 2005 %Increase
NetRevenues $6,269 $5,457 14.9%
OperatingIncome 1,128 1,008 11.9%
NetIncome 626 573 9.2%
NetEarningsPerDilutedShare 3.14 2.79 12.5%
Informationisforcontinuingoperations.
FinancialHighlights
Y EA R E ND ED DE CE MB ER 31
inmillions,exceptpersharedata