Quest Diagnostics 2006 Annual Report Download - page 124
Download and view the complete annual report
Please find page 124 of the 2006 Quest Diagnostics annual report below. You can navigate through the pages in the report by either clicking on the pages listed below, or by using the keyword search tool below to find specific information within the annual report.-
 1
1 -
2
-
3
-
4
-
5
-
6
-
7
-
8
-
9
-
10
-
11
-
12
-
13
-
14
-
15
-
16
-
17
-
18
-
19
-
20
-
21
-
22
-
23
-
24
-
25
-
26
-
27
-
28
-
29
-
30
-
31
-
32
-
33
-
34
-
35
-
36
-
37
-
38
-
39
-
40
-
41
-
42
-
43
-
44
-
45
-
46
-
47
-
48
-
49
-
50
-
51
-
52
-
53
-
54
-
55
-
56
-
57
-
58
-
59
-
60
-
61
-
62
-
63
-
64
-
65
-
66
-
67
-
68
-
69
-
70
-
71
-
72
-
73
-
74
-
75
-
76
-
77
-
78
-
79
-
80
-
81
-
82
-
83
-
84
-
85
-
86
-
87
-
88
-
89
-
90
-
91
-
92
-
93
-
94
-
95
-
96
-
97
-
98
-
99
-
100
-
101
-
102
-
103
-
104
-
105
-
106
-
107
-
108
-
109
-
110
-
111
-
112
-
113
-
 114
114 -
 115
115 -
 116
116 -
 117
117 -
 118
118 -
 119
119 -
 120
120 -
 121
121 -
 122
122 -
 123
123 -
 124
124 -
 125
125 -
 126
126 -
 127
127 -
 128
128 -
 129
129 -
 130
130 -
 131
131
 |
 |

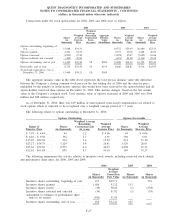
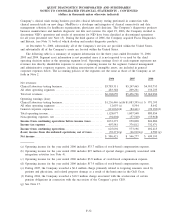
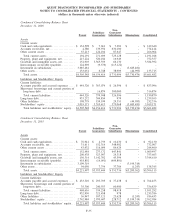
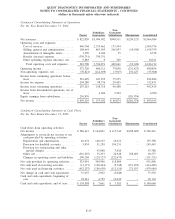
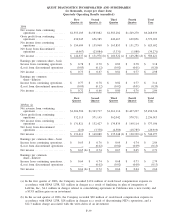
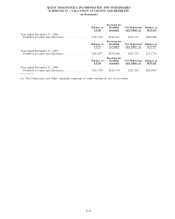
QUEST DIAGNOSTICS INCORPORATED AND SUBSIDIARIES
NOTES TO CONSOLIDATED FINANCIAL STATEMENTS - CONTINUED
(dollars in thousands unless otherwise indicated)
Condensed Consolidating Statement of Operations
For the Year Ended December 31, 2004
Parent
Subsidiary
Guarantors
Non-
Guarantor
Subsidiaries Eliminations Consolidated
Net revenues . ............................. $ 822,020 $3,994,982 $500,511 $(250,527) $5,066,986
Operating costs and expenses:
Cost of services ......................... 460,768 2,335,662 173,344 - 2,969,774
Selling, general and administrative........ 108,401 863,505 246,953 (19,100) 1,199,759
Amortization of intangible assets ......... 1,399 4,944 35 - 6,378
Royalty (income) expense ................ (330,751) 330,751 - - -
Other operating expense (income), net . . . . 9,883 9 329 - 10,221
Total operating costs and expenses ..... 249,700 3,534,871 420,661 (19,100) 4,186,132
Operating income .......................... 572,320 460,111 79,850 (231,427) 880,854
Non-operating expenses, net ................ (70,821) (212,659) (3,915) 231,427 (55,968)
Income from continuing operations before
taxes.................................... 501,499 247,452 75,935 - 824,886
Income tax expense ........................ 204,280 98,736 29,455 - 332,471
Income from continuing operations ......... 297,219 148,716 46,480 - 492,415
Income from discontinued operations, net of
taxes.................................... - 4,386 2,394 - 6,780
Equity earnings from subsidiaries . .......... 201,976 - - (201,976) -
Net income . . . ............................. $ 499,195 $ 153,102 $ 48,874 $(201,976) $ 499,195
Condensed Consolidating Statement of Cash Flows
For the Year Ended December 31, 2006
Parent
Subsidiary
Guarantors
Non-
Guarantor
Subsidiaries Eliminations Consolidated
Cash flows from operating activities:
Net income . . . ............................. $ 586,421 $ 144,861 $ 113,742 $(258,603) $ 586,421
Adjustments to reconcile net income to net
cash provided by operating activities:
Depreciation and amortization . ........... 46,674 140,103 10,621 - 197,398
Provision for doubtful accounts........... 5,934 51,258 186,251 - 243,443
Provision for restructuring and other
special charges ........................ - 47,868 7,920 - 55,788
Other, net . . ............................. (316,207) 55,233 22,948 258,603 20,577
Changes in operating assets and liabilities. 200,269 (129,327) (222,673) - (151,731)
Net cash provided by operating activities. . . . 523,091 309,996 118,809 - 951,896
Net cash used in investing activities ........ (13,177) (120,444) (9,748) (271,033) (414,402)
Net cash used in financing activities ........ (452,257) (186,650) (112,110) 271,033 (479,984)
Net change in cash and cash equivalents . . . . 57,657 2,902 (3,049) - 57,510
Cash and cash equivalents, beginning of
year .................................... 76,941 4,759 10,430 - 92,130
Cash and cash equivalents, end of year . . . . . $ 134,598 $ 7,661 $ 7,381 $ - $ 149,640
F-37