Quest Diagnostics 2006 Annual Report Download - page 126
Download and view the complete annual report
Please find page 126 of the 2006 Quest Diagnostics annual report below. You can navigate through the pages in the report by either clicking on the pages listed below, or by using the keyword search tool below to find specific information within the annual report.-
 1
1 -
2
-
3
-
4
-
5
-
6
-
7
-
8
-
9
-
10
-
11
-
12
-
13
-
14
-
15
-
16
-
17
-
18
-
19
-
20
-
21
-
22
-
23
-
24
-
25
-
26
-
27
-
28
-
29
-
30
-
31
-
32
-
33
-
34
-
35
-
36
-
37
-
38
-
39
-
40
-
41
-
42
-
43
-
44
-
45
-
46
-
47
-
48
-
49
-
50
-
51
-
52
-
53
-
54
-
55
-
56
-
57
-
58
-
59
-
60
-
61
-
62
-
63
-
64
-
65
-
66
-
67
-
68
-
69
-
70
-
71
-
72
-
73
-
74
-
75
-
76
-
77
-
78
-
79
-
80
-
81
-
82
-
83
-
84
-
85
-
86
-
87
-
88
-
89
-
90
-
91
-
92
-
93
-
94
-
95
-
96
-
97
-
98
-
99
-
100
-
101
-
102
-
103
-
104
-
105
-
106
-
107
-
108
-
109
-
110
-
111
-
112
-
113
-
114
-
115
-
 116
116 -
 117
117 -
 118
118 -
 119
119 -
 120
120 -
 121
121 -
 122
122 -
 123
123 -
 124
124 -
 125
125 -
 126
126 -
 127
127 -
 128
128 -
 129
129 -
 130
130 -
 131
131
 |
 |

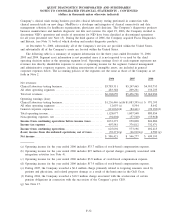
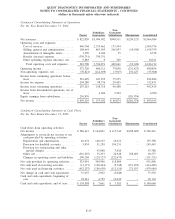
QUEST DIAGNOSTICS INCORPORATED AND SUBSIDIARIES
(in thousands, except per share data)
Quarterly Operating Results (unaudited)
First
Quarter (i)
Second
Quarter (i)
Third
Quarter
Fourth
Quarter
Total
Year
2006
Net revenue from continuing
operations ....................... $1,553,105 $1,583,082 $1,583,202 $1,549,270 $6,268,659
Gross profit from continuing
operations ....................... 636,945 656,385 649,467 629,856 2,572,653
Net income from continuing
operations ....................... $ 154,604 $ 155,960 $ 163,853 $ 151,275 $ 625,692
Net (loss) from discontinued
operations ....................... (9,967) (23,984) (3,331) (1,989) (39,271)
Net income ........................ $ 144,637 (a) $ 131,976 (b) $ 160,522 (c) $ 149,286 (d) $ 586,421
Earnings per common share – basic
Income from continuing operations . . $ 0.78 $ 0.79 $ 0.83 $ 0.78 $ 3.18
(Loss) from discontinued operations . (0.05) (0.12) (0.02) (0.01) (0.20)
Net income ........................ $ 0.73 $ 0.67 $ 0.81 $ 0.77 $ 2.98
Earnings per common
share – dilutive
Income from continuing operations . . $ 0.77 $ 0.78 $ 0.82 $ 0.77 $ 3.14
(Loss) from discontinued operations . (0.05) (0.12) (0.02) (0.01) (0.20)
Net income ........................ $ 0.72 $ 0.66 $ 0.80 $ 0.76 $ 2.94
First
Quarter
Second
Quarter
Third
Quarter
Fourth
Quarter
Total
Year
2005(e) (i)
Net revenue from continuing
operations ....................... $1,304,596 $1,363,717 $1,361,116 $1,427,297 $5,456,726
Gross profit from continuing
operations ....................... 532,115 571,145 562,042 570,711 2,236,013
Net income from continuing
operations ....................... $ 131,821 $ 152,427 $ 139,834 $ 149,114 $ 573,196
Net (loss) from discontinued
operations ....................... (210) (3,338) (4,586) (18,785) (26,919)
Net income ........................ $ 131,611 $ 149,089 $ 135,248 (f) $ 130,329 (g) $ 546,277
Earnings per common share – basic
Income from continuing operations . . $ 0.65 $ 0.76 $ 0.69 $ 0.74 $ 2.84
(Loss) from discontinued operations . – (0.02) (0.02) (0.09) (0.13)
Net income ........................ $ 0.65 (h) $ 0.74 $ 0.67 $ 0.65 $ 2.71
Earnings per common
share – dilutive
Income from continuing operations . . $ 0.64 $ 0.74 $ 0.68 $ 0.73 $ 2.79
(Loss) from discontinued operations . – (0.02) (0.02) (0.09) (0.13)
Net income ........................ $ 0.64 (h) $ 0.72 $ 0.66 $ 0.64 $ 2.66
(a) In the first quarter of 2006, the Company recorded $19.4 million of stock-based compensation expense in
accordance with SFAS 123R, $21 million in charges as a result of finalizing its plan of integration of
LabOne, Inc., $4.1 million in charges related to consolidating operations in California into a new facility and
a $15.8 million gain on an investment.
(b) In the second quarter of 2006, the Company recorded $20 million of stock-based compensation expense in
accordance with SFAS 123R, $28 million in charges as a result of discontinuing NID’s operations, and a
$12.3 million charge associated with the write-down of an investment.
F-39