Quest Diagnostics 2006 Annual Report Download - page 100
Download and view the complete annual report
Please find page 100 of the 2006 Quest Diagnostics annual report below. You can navigate through the pages in the report by either clicking on the pages listed below, or by using the keyword search tool below to find specific information within the annual report.-
 1
1 -
2
-
3
-
4
-
5
-
6
-
7
-
8
-
9
-
10
-
11
-
12
-
13
-
14
-
15
-
16
-
17
-
18
-
19
-
20
-
21
-
22
-
23
-
24
-
25
-
26
-
27
-
28
-
29
-
30
-
31
-
32
-
33
-
34
-
35
-
36
-
37
-
38
-
39
-
40
-
41
-
42
-
43
-
44
-
45
-
46
-
47
-
48
-
49
-
50
-
51
-
52
-
53
-
54
-
55
-
56
-
57
-
58
-
59
-
60
-
61
-
62
-
63
-
64
-
65
-
66
-
67
-
68
-
69
-
70
-
71
-
72
-
73
-
74
-
75
-
76
-
77
-
78
-
79
-
80
-
81
-
82
-
83
-
84
-
85
-
86
-
87
-
88
-
89
-
 90
90 -
 91
91 -
 92
92 -
 93
93 -
 94
94 -
 95
95 -
 96
96 -
 97
97 -
 98
98 -
 99
99 -
 100
100 -
 101
101 -
 102
102 -
 103
103 -
 104
104 -
 105
105 -
 106
106 -
 107
107 -
 108
108 -
 109
109 -
 110
110 -
111
-
112
-
113
-
114
-
115
-
116
-
117
-
118
-
119
-
120
-
121
-
122
-
123
-
124
-
125
-
126
-
127
-
128
-
129
-
130
-
131
 |
 |

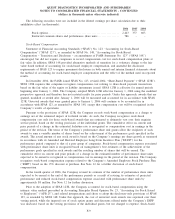
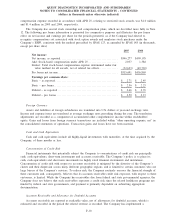
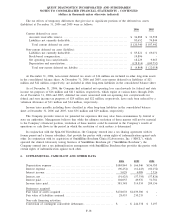
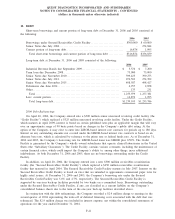
Investments at December 31, 2006 and 2005 consisted of the following:
2006 2005
Available-for-sale equity securities ...................................... $10,106 $20,429
Trading equity securities ............................................... 29,969 25,738
Other investments ...................................................... 13,290 29,726
Total ............................................................. $53,365 $75,893
Investments in available-for-sale equity securities consist of equity securities in public corporations.
Investments in trading equity securities represent participant directed investments of deferred employee
compensation and related Company matching contributions held in a trust pursuant to the Company’s
supplemental deferred compensation plan (see Note 12). Other investments do not have readily determinable fair
values and consist of investments in preferred and common shares of privately held companies and are accounted
for under the cost method.
As of December 31, 2006 and 2005, the Company had gross unrealized losses from available-for-sale equity
securities of $4.7 million and $11.1 million, respectively. For the year ended December 31, 2006, “other
(expense) income, net”, within the consolidated statements of operations, includes $16.2 million of charges
associated with the write-down of available-for-sale equity securities, $10.0 million of charges associated with the
write-down of other investments and a $15.8 million gain associated with other investments. For the year ended
December 31, 2005, “other (expense) income, net” includes a $7.1 million charge associated with the write-down
of other investments. For the years ended December 31, 2006, 2005 and 2004, gains from trading equity
securities totaled $3.2 million, $1.6 million and $1.8 million, respectively, and are included in “other (expense)
income, net”.
Financial Instruments
The Company’s policy for managing exposure to market risks may include the use of financial instruments,
including derivatives. The Company has established policies and procedures for risk assessment and the approval,
reporting and monitoring of derivative financial instrument activities. These policies prohibit holding or issuing
derivative financial instruments for speculative purposes.
SFAS No. 133, “Accounting for Derivative Instruments and Hedging Activities” (“SFAS 133”), as amended,
requires that all derivative instruments be recorded on the balance sheet at their fair value. Changes in the fair
value of derivatives are recorded each period in current earnings or other comprehensive income, depending on
whether a derivative is designated as part of a hedge transaction and, if it is, the type of hedge transaction.
Fair Value of Financial Instruments
The carrying amounts of cash and cash equivalents, accounts receivable and accounts payable and accrued
expenses approximate fair value based on the short maturity of these instruments. At both December 31, 2006
and 2005, the fair value of the Company’s debt was estimated at $1.6 billion, using quoted market prices and
yields for the same or similar types of borrowings, taking into account the underlying terms of the debt
instruments. At December 31, 2006 and 2005, the estimated fair value exceeded the carrying value of the debt by
$0.4 million and $39 million, respectively.
Comprehensive (Loss) Income
Comprehensive (loss) income encompasses all changes in stockholders’ equity (except those arising from
transactions with stockholders) and includes net income, net unrealized capital gains or losses on available-for-
sale securities, foreign currency translation adjustments and deferred gains related to the settlement of certain
treasury lock agreements (see Note 10).
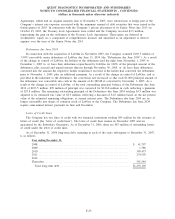
New Accounting Standards
In July 2006, the FASB issued FASB Interpretation No. 48 “Accounting for Uncertainty in Income Taxes”
(“FIN 48”). FIN 48 is effective for the Company as of January 1, 2007. FIN 48 clarifies the accounting for
F-13
QUEST DIAGNOSTICS INCORPORATED AND SUBSIDIARIES
NOTES TO CONSOLIDATED FINANCIAL STATEMENTS - CONTINUED
(dollars in thousands unless otherwise indicated)