Quest Diagnostics 2006 Annual Report Download - page 91
Download and view the complete annual report
Please find page 91 of the 2006 Quest Diagnostics annual report below. You can navigate through the pages in the report by either clicking on the pages listed below, or by using the keyword search tool below to find specific information within the annual report.-
 1
1 -
2
-
3
-
4
-
5
-
6
-
7
-
8
-
9
-
10
-
11
-
12
-
13
-
14
-
15
-
16
-
17
-
18
-
19
-
20
-
21
-
22
-
23
-
24
-
25
-
26
-
27
-
28
-
29
-
30
-
31
-
32
-
33
-
34
-
35
-
36
-
37
-
38
-
39
-
40
-
41
-
42
-
43
-
44
-
45
-
46
-
47
-
48
-
49
-
50
-
51
-
52
-
53
-
54
-
55
-
56
-
57
-
58
-
59
-
60
-
61
-
62
-
63
-
64
-
65
-
66
-
67
-
68
-
69
-
70
-
71
-
72
-
73
-
74
-
75
-
76
-
77
-
78
-
79
-
80
-
 81
81 -
 82
82 -
 83
83 -
 84
84 -
 85
85 -
 86
86 -
 87
87 -
 88
88 -
 89
89 -
 90
90 -
 91
91 -
 92
92 -
 93
93 -
 94
94 -
 95
95 -
 96
96 -
 97
97 -
 98
98 -
 99
99 -
 100
100 -
 101
101 -
102
-
103
-
104
-
105
-
106
-
107
-
108
-
109
-
110
-
111
-
112
-
113
-
114
-
115
-
116
-
117
-
118
-
119
-
120
-
121
-
122
-
123
-
124
-
125
-
126
-
127
-
128
-
129
-
130
-
131
 |
 |

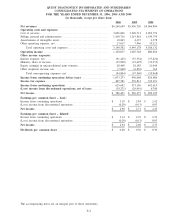
QUEST DIAGNOSTICS INCORPORATED AND SUBSIDIARIES
CONSOLIDATED STATEMENTS OF OPERATIONS
FOR THE YEARS ENDED DECEMBER 31, 2006, 2005 AND 2004
(in thousands, except per share data)
2006 2005 2004
Net revenues ......................................................... $6,268,659 $5,456,726 $5,066,986
Operating costs and expenses:
Cost of services ....................................................... 3,696,006 3,220,713 2,969,774
Selling, general and administrative ..................................... 1,410,716 1,215,862 1,199,759
Amortization of intangible assets . ...................................... 10,843 4,637 6,378
Other operating expense, net ........................................... 23,017 7,966 10,221
Total operating costs and expenses................................. 5,140,582 4,449,178 4,186,132
Operating income .................................................... 1,128,077 1,007,548 880,854
Other income (expense):
Interest expense, net ................................................... (91,425) (57,354) (57,826)
Minority share of income .............................................. (23,900) (19,495) (19,353)
Equity earnings in unconsolidated joint ventures......................... 28,469 26,185 21,049
Other (expense) income, net. ........................................... (7,948) (6,876) 162
Total non-operating expenses, net .................................. (94,804) (57,540) (55,968)
Income from continuing operations before taxes ...................... 1,033,273 950,008 824,886
Income tax expense................................................... 407,581 376,812 332,471
Income from continuing operations ................................... 625,692 573,196 492,415
(Loss) income from discontinued operations, net of taxes ............. (39,271) (26,919) 6,780
Net income ........................................................... $ 586,421 $ 546,277 $ 499,195
Earnings per common share – basic:
Income from continuing operations ..................................... $ 3.18 $ 2.84 $ 2.42
(Loss) income from discontinued operations............................. (0.20) (0.13) 0.03
Net income ........................................................... $ 2.98 $ 2.71 $ 2.45
Earnings per common share – diluted:
Income from continuing operations ..................................... $ 3.14 $ 2.79 $ 2.32
(Loss) income from discontinued operations............................. (0.20) (0.13) 0.03
Net income ........................................................... $ 2.94 $ 2.66 $ 2.35
Dividends per common share ......................................... $ 0.40 $ 0.36 $ 0.30
F-4
The accompanying notes are an integral part of these statements.