Quest Diagnostics 2006 Annual Report Download - page 123
Download and view the complete annual report
Please find page 123 of the 2006 Quest Diagnostics annual report below. You can navigate through the pages in the report by either clicking on the pages listed below, or by using the keyword search tool below to find specific information within the annual report.-
 1
1 -
2
-
3
-
4
-
5
-
6
-
7
-
8
-
9
-
10
-
11
-
12
-
13
-
14
-
15
-
16
-
17
-
18
-
19
-
20
-
21
-
22
-
23
-
24
-
25
-
26
-
27
-
28
-
29
-
30
-
31
-
32
-
33
-
34
-
35
-
36
-
37
-
38
-
39
-
40
-
41
-
42
-
43
-
44
-
45
-
46
-
47
-
48
-
49
-
50
-
51
-
52
-
53
-
54
-
55
-
56
-
57
-
58
-
59
-
60
-
61
-
62
-
63
-
64
-
65
-
66
-
67
-
68
-
69
-
70
-
71
-
72
-
73
-
74
-
75
-
76
-
77
-
78
-
79
-
80
-
81
-
82
-
83
-
84
-
85
-
86
-
87
-
88
-
89
-
90
-
91
-
92
-
93
-
94
-
95
-
96
-
97
-
98
-
99
-
100
-
101
-
102
-
103
-
104
-
105
-
106
-
107
-
108
-
109
-
110
-
111
-
112
-
 113
113 -
 114
114 -
 115
115 -
 116
116 -
 117
117 -
 118
118 -
 119
119 -
 120
120 -
 121
121 -
 122
122 -
 123
123 -
 124
124 -
 125
125 -
 126
126 -
 127
127 -
 128
128 -
 129
129 -
 130
130 -
 131
131
 |
 |

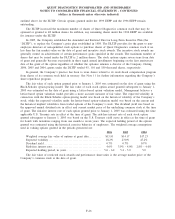
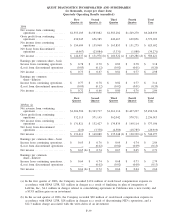
QUEST DIAGNOSTICS INCORPORATED AND SUBSIDIARIES
NOTES TO CONSOLIDATED FINANCIAL STATEMENTS - CONTINUED
(dollars in thousands unless otherwise indicated)
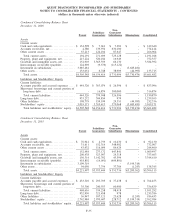
Condensed Consolidating Statement of Operations
For the Year Ended December 31, 2006
Parent
Subsidiary
Guarantors
Non-
Guarantor
Subsidiaries Eliminations Consolidated
Net revenues . ............................. $ 942,692 $4,995,640 $710,692 $(380,365) $6,268,659
Operating costs and expenses:
Cost of services ......................... 501,942 2,958,591 235,473 - 3,696,006
Selling, general and administrative........ 147,862 1,020,774 264,488 (22,408) 1,410,716
Amortization of intangible assets ......... 1,451 8,924 468 - 10,843
Royalty (income) expense ................ (394,693) 394,693 - - -
Other operating expense, net . . . .......... (3,358) 24,704 1,671 - 23,017
Total operating costs and expenses ..... 253,204 4,407,686 502,100 (22,408) 5,140,582
Operating income .......................... 689,488 587,954 208,592 (357,957) 1,128,077
Non-operating income (expense), net........ (160,244) (295,672) 3,155 357,957 (94,804)
Income from continuing operations before
taxes.................................... 529,244 292,282 211,747 - 1,033,273
Income tax expense ........................ 201,426 118,441 87,714 - 407,581
Income from continuing operations ......... 327,818 173,841 124,033 - 625,692
Loss from discontinued operations, net of
taxes.................................... - (28,980) (10,291) - (39,271)
Equity earnings from subsidiaries . .......... 258,603 - - (258,603) –
Net income . . . ............................. $ 586,421 $ 144,861 $113,742 $(258,603) $ 586,421
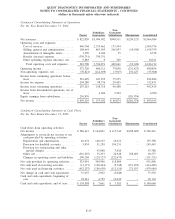
Condensed Consolidating Statement of Operations
For the Year Ended December 31, 2005
Parent
Subsidiary
Guarantors
Non-
Guarantor
Subsidiaries Eliminations Consolidated
Net revenues . ............................. $ 874,113 $4,319,625 $544,174 $(281,186) $5,456,726
Operating costs and expenses:
Cost of services ......................... 491,029 2,540,063 189,621 - 3,220,713
Selling, general and administrative........ 102,040 879,544 254,912 (20,634) 1,215,862
Amortization of intangible assets ......... 1,628 2,991 18 - 4,637
Royalty (income) expense ................ (352,743) 352,743 - - -
Other operating expense, net . . . .......... 8,288 (13) (309) - 7,966
Total operating costs and expenses ..... 250,242 3,775,328 444,242 (20,634) 4,449,178
Operating income .......................... 623,871 544,297 99,932 (260,552) 1,007,548
Non-operating expenses, net ................ (97,718) (219,652) (722) 260,552 (57,540)
Income from continuing operations before
taxes.................................... 526,153 324,645 99,210 - 950,008
Income tax expense ........................ 206,703 129,987 40,122 - 376,812
Income from continuing operations ......... 319,450 194,658 59,088 - 573,196
Loss from discontinued operations, net of
taxes.................................... - (26,437) (482) - (26,919)
Equity earnings from subsidiaries . .......... 226,827 - - (226,827) -
Net income . . . ............................. $ 546,277 $ 168,221 $ 58,606 $(226,827) $ 546,277
F-36