Quest Diagnostics 2006 Annual Report Download - page 129
Download and view the complete annual report
Please find page 129 of the 2006 Quest Diagnostics annual report below. You can navigate through the pages in the report by either clicking on the pages listed below, or by using the keyword search tool below to find specific information within the annual report.-
 1
1 -
2
-
3
-
4
-
5
-
6
-
7
-
8
-
9
-
10
-
11
-
12
-
13
-
14
-
15
-
16
-
17
-
18
-
19
-
20
-
21
-
22
-
23
-
24
-
25
-
26
-
27
-
28
-
29
-
30
-
31
-
32
-
33
-
34
-
35
-
36
-
37
-
38
-
39
-
40
-
41
-
42
-
43
-
44
-
45
-
46
-
47
-
48
-
49
-
50
-
51
-
52
-
53
-
54
-
55
-
56
-
57
-
58
-
59
-
60
-
61
-
62
-
63
-
64
-
65
-
66
-
67
-
68
-
69
-
70
-
71
-
72
-
73
-
74
-
75
-
76
-
77
-
78
-
79
-
80
-
81
-
82
-
83
-
84
-
85
-
86
-
87
-
88
-
89
-
90
-
91
-
92
-
93
-
94
-
95
-
96
-
97
-
98
-
99
-
100
-
101
-
102
-
103
-
104
-
105
-
106
-
107
-
108
-
109
-
110
-
111
-
112
-
113
-
114
-
115
-
116
-
117
-
118
-
 119
119 -
 120
120 -
 121
121 -
 122
122 -
 123
123 -
 124
124 -
 125
125 -
 126
126 -
 127
127 -
 128
128 -
 129
129 -
 130
130 -
 131
131
 |
 |

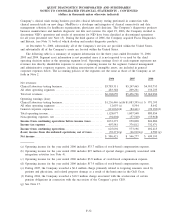
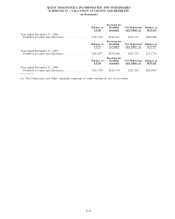
QUEST DIAGNOSTICS INCORPORATED AND SUBSIDIARIES
RECONCILIATION OF NON-GAAP MEASURES
The following is a reconciliation of non-GAAP measures presented in the financial highlights to their most
comparable measure under generally accepted accounting principles.
2001 2000 1999 1998 1997
Year Ended December 31,
Income from continuing operations.................. $161,624 $105,545 $ 3,349 $ 30,096 $ (19,692)
Add:
Amortization of goodwill, net of taxes ................ 35,246 35,305 21,295 13,415 13,550
Provision for restructuring and other special charges,
net of taxes ....................................... - - 44,118 - 39,881
Loss on debt extinguishment, net of taxes ............. 25,207 2,896 2,139 - -
Adjusted income from continuing operations ........ $222,077 $143,746 $ 70,901 $ 43,511 $ 33,739
Diluted earnings per common share
Income from continuing operations.................... $ 0.83 $ 0.56 $ 0.03 $ 0.25 $ (0.17)
Adjusted income from continuing operations........... $ 1.13 $ 0.76 $ 0.49 $ 0.36 $ 0.29
Weighted average number of common shares
outstanding - diluted ............................... 195,779 188,601 143,309 120,916 116,752
Reconciliation of Non-GAAP Measures