Quest Diagnostics 2006 Annual Report Download - page 92
Download and view the complete annual report
Please find page 92 of the 2006 Quest Diagnostics annual report below. You can navigate through the pages in the report by either clicking on the pages listed below, or by using the keyword search tool below to find specific information within the annual report.-
 1
1 -
2
-
3
-
4
-
5
-
6
-
7
-
8
-
9
-
10
-
11
-
12
-
13
-
14
-
15
-
16
-
17
-
18
-
19
-
20
-
21
-
22
-
23
-
24
-
25
-
26
-
27
-
28
-
29
-
30
-
31
-
32
-
33
-
34
-
35
-
36
-
37
-
38
-
39
-
40
-
41
-
42
-
43
-
44
-
45
-
46
-
47
-
48
-
49
-
50
-
51
-
52
-
53
-
54
-
55
-
56
-
57
-
58
-
59
-
60
-
61
-
62
-
63
-
64
-
65
-
66
-
67
-
68
-
69
-
70
-
71
-
72
-
73
-
74
-
75
-
76
-
77
-
78
-
79
-
80
-
81
-
 82
82 -
 83
83 -
 84
84 -
 85
85 -
 86
86 -
 87
87 -
 88
88 -
 89
89 -
 90
90 -
 91
91 -
 92
92 -
 93
93 -
 94
94 -
 95
95 -
 96
96 -
 97
97 -
 98
98 -
 99
99 -
 100
100 -
 101
101 -
 102
102 -
103
-
104
-
105
-
106
-
107
-
108
-
109
-
110
-
111
-
112
-
113
-
114
-
115
-
116
-
117
-
118
-
119
-
120
-
121
-
122
-
123
-
124
-
125
-
126
-
127
-
128
-
129
-
130
-
131
 |
 |

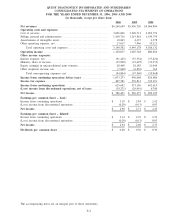
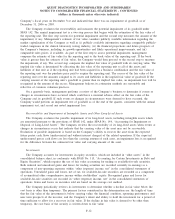
QUEST DIAGNOSTICS INCORPORATED AND SUBSIDIARIES
CONSOLIDATED STATEMENTS OF CASH FLOWS
FOR THE YEARS ENDED DECEMBER 31, 2006, 2005 AND 2004
(in thousands)
2006 2005 2004
Cash flows from operating activities:
Net income............................................................. $ 586,421 $ 546,277 $ 499,195
Adjustments to reconcile net income to net cash provided by operating
activities:
Depreciation and amortization ........................................... 197,398 176,124 168,726
Provision for doubtful accounts.......................................... 243,443 233,628 226,310
Provision for restructuring and other special charges. . . ................... 55,788 - -
Deferred income tax (benefit) provision .................................. (46,280) 661 52,451
Minority share of income . .............................................. 23,900 19,495 19,353
Stock compensation expense ............................................ 55,478 2,037 1,384
Tax benefits associated with stock-based compensation plans.............. - 33,823 71,276
Excess tax benefits from stock-based compensation arrangements.......... (32,693) - -
Other, net .............................................................. 20,172 21,673 4,739
Changes in operating assets and liabilities:
Accounts receivable . . .............................................. (273,232) (238,421) (266,404)
Accounts payable and accrued expenses . ............................ 81,347 36,038 22,336
Integration, settlement and other special charges . . ................... (4,247) (5,400) (18,274)
Income taxes payable .............................................. 45,330 15,382 1,163
Other assets and liabilities, net. ..................................... (929) 10,266 16,525
Net cash provided by operating activities .............................. 951,896 851,583 798,780
Cash flows from investing activities:
Business acquisitions, net of cash acquired . . . ............................ (236,543) (814,219) -
Capital expenditures .................................................... (193,422) (224,270) (176,125)
Decrease (increase) in investments and other assets ....................... 15,563 (41,304) 2,425
Net cash used in investing activities.................................... (414,402) (1,079,793) (173,700)
Cash flows from financing activities:
Proceeds from borrowings. .............................................. 375,000 1,100,186 304,921
Repayments of debt..................................................... (416,208) (497,276) (306,018)
(Decrease) increase in book overdrafts ................................... (1,705) 33,384 -
Purchases of treasury stock.............................................. (472,325) (390,163) (734,577)
Exercise of stock options. . .............................................. 102,324 98,335 109,116
Excess tax benefits from stock-based compensation arrangements.......... 32,693 - -
Dividends paid . . ....................................................... (77,135) (69,673) (61,387)
Distributions to minority partners . . . ..................................... (21,900) (21,477) (16,677)
Financing costs paid .................................................... (728) (6,278) (2,114)
Net cash (used in) provided by financing activities ..................... (479,984) 247,038 (706,736)
Net change in cash and cash equivalents ............................... 57,510 18,828 (81,656)
Cash and cash equivalents, beginning of year .......................... 92,130 73,302 154,958
Cash and cash equivalents, end of year ................................ $ 149,640 $ 92,130 $ 73,302
F-5
The accompanying notes are an integral part of these statements.