Quest Diagnostics 2006 Annual Report Download - page 80
Download and view the complete annual report
Please find page 80 of the 2006 Quest Diagnostics annual report below. You can navigate through the pages in the report by either clicking on the pages listed below, or by using the keyword search tool below to find specific information within the annual report.-
 1
1 -
2
-
3
-
4
-
5
-
6
-
7
-
8
-
9
-
10
-
11
-
12
-
13
-
14
-
15
-
16
-
17
-
18
-
19
-
20
-
21
-
22
-
23
-
24
-
25
-
26
-
27
-
28
-
29
-
30
-
31
-
32
-
33
-
34
-
35
-
36
-
37
-
38
-
39
-
40
-
41
-
42
-
43
-
44
-
45
-
46
-
47
-
48
-
49
-
50
-
51
-
52
-
53
-
54
-
55
-
56
-
57
-
58
-
59
-
60
-
61
-
62
-
63
-
64
-
65
-
66
-
67
-
68
-
69
-
 70
70 -
 71
71 -
 72
72 -
 73
73 -
 74
74 -
 75
75 -
 76
76 -
 77
77 -
 78
78 -
 79
79 -
 80
80 -
 81
81 -
 82
82 -
 83
83 -
 84
84 -
 85
85 -
 86
86 -
 87
87 -
 88
88 -
 89
89 -
 90
90 -
91
-
92
-
93
-
94
-
95
-
96
-
97
-
98
-
99
-
100
-
101
-
102
-
103
-
104
-
105
-
106
-
107
-
108
-
109
-
110
-
111
-
112
-
113
-
114
-
115
-
116
-
117
-
118
-
119
-
120
-
121
-
122
-
123
-
124
-
125
-
126
-
127
-
128
-
129
-
130
-
131
 |
 |
Other (expense) income, net represents miscellaneous income and expense items related to non-operating
activities such as gains and losses associated with investments and other non-operating assets. For the year ended
December 31, 2006, other (expense) income, net includes $26 million of charges related to the write-downs of
investments offset by a gain of $16 million on the sale of an investment.
For the year ended December 31, 2005, other (expense) income, net includes a $7.1 million charge
associated with the write-down of an investment.
Discontinued Operations
During the fourth quarter of 2005, NID instituted its second voluntary product hold within a six-month
period, due to quality issues, which adversely impacted the operating performance of NID. As a result, we
evaluated a number of strategic options for NID. On April 19, 2006, we decided to discontinue NID’s operations,
and during the third quarter of 2006, we completed the wind-down of NID’s operations. Results of NID are
reported as discontinued operations for all periods presented.
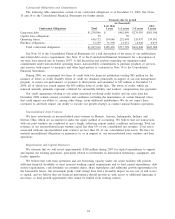
Loss from discontinued operations, net of tax, for the year ended December 31, 2006 increased to $39
million, or $0.20 per diluted share, compared to $27 million, or $0.13 per diluted share in 2005. Results for the
year ended December 31, 2006 reflect pre-tax charges of $32 million, primarily related to the wind-down of
NID’s operations. These charges included: inventory write-offs of $7 million; asset impairment charges of $6
million; employee severance costs of $6 million; contract termination costs of $6 million; facility closure costs of
$2 million; and costs to support activities to wind-down the business, comprised primarily of employee costs and
professional fees, of $5 million.
The government continues to investigate and review NID. Any costs resulting from this review will be
included in discontinued operations. While we do not believe that these matters will have a material adverse
impact on our overall financial condition, their final resolution could be material to our results of operations or
cash flows in the period in which the impact of such matters is determined or paid. See Note 14 to the
Consolidated Financial Statements for a further description of these matters.
Year Ended December 31, 2005 Compared with Year Ended December 31, 2004
Continuing Operations
Income from continuing operations for the year ended December 31, 2005 increased to $573 million, or
$2.79 per diluted share, compared to $492 million, or $2.32 per diluted share in 2004.
The increase in income from continuing operations was primarily attributable to organic revenue growth, and
increases in operating efficiencies in our clinical testing business resulting from our Six Sigma and
standardization efforts, in addition to efficiencies resulting from increased use of electronic ordering by
physicians.
Net Revenues
Net revenues for the year ended December 31, 2005 grew by 7.7% over the prior year level to $5.5 billion.
The acquisition of LabOne, which was completed on November 1, 2005, contributed 1.8% of the revenue growth.
Approximately 55% of LabOne’s net revenues are generated from risk assessment services provided to life
insurance companies, with the remainder classified as clinical laboratory testing.
Our clinical testing business, which accounted for over 96% of our 2005 net revenues, grew approximately
7% for the year. The acquisition of LabOne contributed approximately 1% to growth in the clinical testing
business, principally reflected in volume. The increase in clinical testing revenues was driven by improvements in
both testing volumes, measured by the number of requisitions, and increases in average revenue per requisition.
For the year ended December 31, 2005, clinical testing volume increased 4.4% compared to the prior year
period.
For the year ended December 31, 2005, average revenue per requisition improved 2.3%. These improvements
are primarily attributable to a continuing shift in test mix to higher value testing, including gene-based and
esoteric testing, and increases in the number of tests ordered per requisition. Gene-based and esoteric testing net
revenues were over $900 million for 2005, and grew approximately 10% compared to the prior year. Although
LabOne’s clinical testing business carries a lower revenue per requisition than our average, principally due to a
higher concentration of lower priced drugs-of-abuse testing, the acquisition of LabOne did not have a significant
59