Priceline 2011 Annual Report Download - page 91
Download and view the complete annual report
Please find page 91 of the 2011 Priceline annual report below. You can navigate through the pages in the report by either clicking on the pages listed below, or by using the keyword search tool below to find specific information within the annual report.-
 1
1 -
2
-
3
-
4
-
5
-
6
-
7
-
8
-
9
-
10
-
11
-
12
-
13
-
14
-
15
-
16
-
17
-
18
-
19
-
20
-
21
-
22
-
23
-
24
-
25
-
26
-
27
-
28
-
29
-
30
-
31
-
32
-
33
-
34
-
35
-
36
-
37
-
38
-
39
-
40
-
41
-
42
-
43
-
44
-
45
-
46
-
47
-
48
-
49
-
50
-
51
-
52
-
53
-
54
-
55
-
56
-
57
-
58
-
59
-
60
-
61
-
62
-
63
-
64
-
65
-
66
-
67
-
68
-
69
-
70
-
71
-
72
-
73
-
74
-
75
-
76
-
77
-
78
-
79
-
80
-
 81
81 -
 82
82 -
 83
83 -
 84
84 -
 85
85 -
 86
86 -
 87
87 -
 88
88 -
 89
89 -
 90
90 -
 91
91 -
 92
92 -
 93
93 -
 94
94 -
 95
95 -
 96
96 -
 97
97 -
 98
98 -
 99
99 -
 100
100 -
 101
101 -
102
-
103
-
104
-
105
-
106
-
107
-
108
-
109
-
110
-
111
 |
 |

90
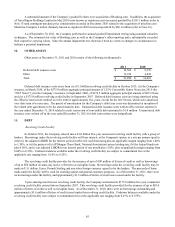
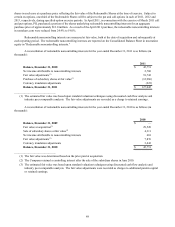
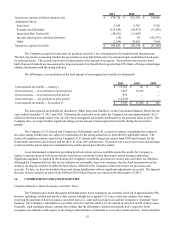
14. ACCUMULATED OTHER COMPREHENSIVE LOSS
The table below provides the balances for each classification of accumulated other comprehensive loss as of
December 31, 2011 and 2010 (in thousands):
Foreign currency translation adjustments (1)
Net unrealized gain on investment securities (2)
Accumulated other comprehensive loss
December 31,
2011
$(88,312)
730
$(87,582)
December 31,
2010
$(33,407)
518
$(32,889)
_____________________________
(1) Includes net gains from fair value adjustments at December 31, 2011 and 2010 associated with net investment hedges
of $46.2 million after tax ($79.1 million before tax) and $15.8 million after tax ($27.1 million before tax), respectively.
The remaining balance in currency translation adjustments excludes income taxes due to the Company’s practice and
intention to reinvest the earnings of its foreign subsidiaries in those operations.
(2) The unrealized gains before tax at December 31, 2011 and 2010 were $1.0 million and $0.7 million, respectively.
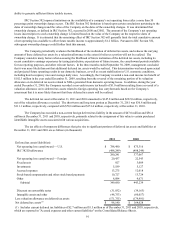
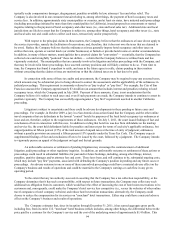
15. INCOME TAXES
Domestic pre-tax income was $144.9 million, $136.3 million and $113.9 million for the years ended December 31,
2011, 2010 and 2009, respectively. Foreign pre-tax income was $1,222.9 million, $610.0 million and $328.4 million for the
years ended December 31, 2011, 2010 and 2009, respectively.
The income tax expense (benefit) for the year ended December 31, 2011 is as follows (in thousands):
Federal
State
Foreign
Total
Current
$ 2,699
9,675
251,542
$ 263,916
Deferred
$ 53,547
(1,389)
(7,411)
$ 44,747
Total
$ 56,246
8,286
244,131
$ 308,663
The income tax expense (benefit) for the year ended December 31, 2010 is as follows (in thousands):
Federal
State
Foreign
Total
Current
$ 4,510
1,114
174,977
$ 180,601
Deferred
$ 37,481
9,368
(9,309)
$ 37,540
Total
$ 41,991
10,482
165,668
$ 218,141
The income tax expense (benefit) for the year ended December 31, 2009 is as follows (in thousands):
Federal
State
Foreign
Total
Current
$ 2,802
1,107
101,205
$ 105,114
Deferred
$(150,935)
6,803
(8,150)
$(152,282)
Total
$(148,133)
7,910
93,055
$(47,168)
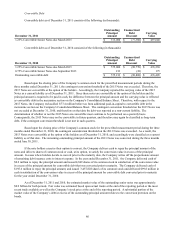
At December 31, 2011, the Company had approximately $2.6 billion of net operating loss carryforwards for U.S.
federal income tax purposes ("NOLs"), comprised of $0.4 billion of NOLs generated from operating losses and approximately
$2.2 billion of NOL tax benefits generated from equity-related transactions, including equity-based compensation and stock
warrants. The NOLs mainly expire from December 31, 2019 to December 31, 2021. The utilization of these NOLs is subject
to limitation under Section 382 of the Internal Revenue Code ("IRC Section 382") and is also dependent upon the Company’s