Priceline 2011 Annual Report Download - page 72
Download and view the complete annual report
Please find page 72 of the 2011 Priceline annual report below. You can navigate through the pages in the report by either clicking on the pages listed below, or by using the keyword search tool below to find specific information within the annual report.-
 1
1 -
2
-
3
-
4
-
5
-
6
-
7
-
8
-
9
-
10
-
11
-
12
-
13
-
14
-
15
-
16
-
17
-
18
-
19
-
20
-
21
-
22
-
23
-
24
-
25
-
26
-
27
-
28
-
29
-
30
-
31
-
32
-
33
-
34
-
35
-
36
-
37
-
38
-
39
-
40
-
41
-
42
-
43
-
44
-
45
-
46
-
47
-
48
-
49
-
50
-
51
-
52
-
53
-
54
-
55
-
56
-
57
-
58
-
59
-
60
-
61
-
 62
62 -
 63
63 -
 64
64 -
 65
65 -
 66
66 -
 67
67 -
 68
68 -
 69
69 -
 70
70 -
 71
71 -
 72
72 -
 73
73 -
 74
74 -
 75
75 -
 76
76 -
 77
77 -
 78
78 -
 79
79 -
 80
80 -
 81
81 -
 82
82 -
83
-
84
-
85
-
86
-
87
-
88
-
89
-
90
-
91
-
92
-
93
-
94
-
95
-
96
-
97
-
98
-
99
-
100
-
101
-
102
-
103
-
104
-
105
-
106
-
107
-
108
-
109
-
110
-
111
 |
 |

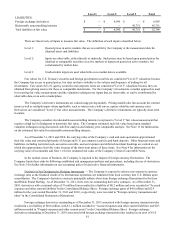
71
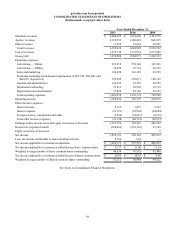
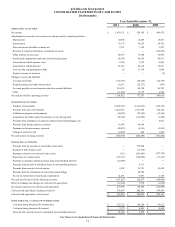
priceline.com Incorporated
CONSOLIDATED STATEMENTS OF CASH FLOWS
(In thousands)
OPERATING ACTIVITIES:
Net income
Adjustments to reconcile net income to net cash provided by operating activities:
Depreciation
Amortization
Provision for uncollectible accounts, net
Reversal of valuation allowances on deferred tax assets
Other deferred income taxes
Stock-based compensation and other stock based payments
Amortization of debt issuance costs
Amortization of debt discount
Loss on early extinguishment of debt
Equity in income of investees
Changes in assets and liabilities:
Accounts receivable
Prepaid expenses and other current assets
Accounts payable, accrued expenses and other current liabilities
Other
Net cash provided by operating activities
INVESTING ACTIVITIES:
Purchase of investments
Proceeds from sale of investments
Additions to property and equipment
Acquisitions and other equity investments, net of cash acquired
Proceeds from redemption of equity investment in pricelinemortgage.com
Proceeds from foreign currency contracts
Payments on foreign currency contracts
Change in restricted cash
Net cash used in investing activities
FINANCING ACTIVITIES:
Proceeds from the issuance of convertible senior notes
Payment of debt issuance costs
Payments related to conversion of senior notes
Repurchase of common stock
Payments to purchase subsidiary shares from noncontrolling interests
Proceeds from the sale of subsidiary shares to noncontrolling interests
Proceeds from exercise of stock options
Proceeds from the termination of conversion spread hedges
Excess tax benefit from stock-based compensation
Net cash (used in) provided by financing activities
Effect of exchange rate changes on cash and cash equivalents
Net increase (decrease) in cash and cash equivalents
Cash and cash equivalents, beginning of period
Cash and cash equivalents, end of period
SUPPLEMENTAL CASH FLOW INFORMATION:
Cash paid during the period for income taxes
Cash paid during the period for interest
Non-cash fair value increase for redeemable noncontrolling interests
Year Ended December 31,
2011
$ 1,059,131
20,648
33,176
9,331
—
44,747
66,194
2,360
21,414
32
—
(125,793)
12,213
210,325
(11,966)
1,341,812
(3,005,397)
2,229,563
(46,833)
(68,192)
—
31,045
(42,032)
(2,922)
(904,768)
—
—
(213)
(163,171)
(12,986)
—
4,302
—
21,041
(151,027)
(12,148)
273,869
358,967
$ 632,836
$ 232,762
$ 7,573
$ 91,743
2010
$ 528,142
16,209
34,255
7,102
—
37,540
68,396
3,332
20,110
11,334
—
(29,275)
(22,373)
84,750
17,775
777,297
(1,813,032)
1,071,669
(22,593)
(112,405)
—
44,564
(9,561)
260
(841,098)
575,000
(13,334)
(295,401)
(129,445)
—
4,311
25,751
42,984
3,091
212,957
7,670
156,826
202,141
$ 358,967
$ 169,320
$ 4,901
$ 7,876
2009
$ 489,472
14,491
24,702
3,227
(183,272)
30,990
40,671
2,465
18,203
1,048
(2)
(22,767)
(979)
86,792
4,624
509,665
(922,163)
432,184
(15,106)
(1,500)
8,921
—
(5,025)
1,229
(501,460)
—
—
(197,122)
(17,415)
—
—
43,428
—
2,149
(168,960)
(1,654)
(162,409)
364,550
$ 202,141
$ 95,512
$ 4,448
$ —
See Notes to Consolidated Financial Statements.