Priceline 2011 Annual Report Download - page 43
Download and view the complete annual report
Please find page 43 of the 2011 Priceline annual report below. You can navigate through the pages in the report by either clicking on the pages listed below, or by using the keyword search tool below to find specific information within the annual report.-
 1
1 -
2
-
3
-
4
-
5
-
6
-
7
-
8
-
9
-
10
-
11
-
12
-
13
-
14
-
15
-
16
-
17
-
18
-
19
-
20
-
21
-
22
-
23
-
24
-
25
-
26
-
27
-
28
-
29
-
30
-
31
-
32
-
 33
33 -
 34
34 -
 35
35 -
 36
36 -
 37
37 -
 38
38 -
 39
39 -
 40
40 -
 41
41 -
 42
42 -
 43
43 -
 44
44 -
 45
45 -
 46
46 -
 47
47 -
 48
48 -
 49
49 -
 50
50 -
 51
51 -
 52
52 -
 53
53 -
54
-
55
-
56
-
57
-
58
-
59
-
60
-
61
-
62
-
63
-
64
-
65
-
66
-
67
-
68
-
69
-
70
-
71
-
72
-
73
-
74
-
75
-
76
-
77
-
78
-
79
-
80
-
81
-
82
-
83
-
84
-
85
-
86
-
87
-
88
-
89
-
90
-
91
-
92
-
93
-
94
-
95
-
96
-
97
-
98
-
99
-
100
-
101
-
102
-
103
-
104
-
105
-
106
-
107
-
108
-
109
-
110
-
111
 |
 |

42
Cost of Revenues
For the year ended December 31, 2011, cost of revenues consisted primarily of: (1) the cost of Name Your Own Price®
hotel room reservations from our suppliers, net of applicable taxes, (2) the cost of Name Your Own Price® rental cars from our
suppliers, net of applicable taxes; and (3) the cost of Name Your Own Price® airline tickets, net of the federal air transportation
tax, segment fees and passenger facility charges imposed in connection with the sale of airline tickets. Cost of revenues for the
year ended December 31, 2011 increased by 8.5%, compared to the same period in 2010, primarily due to the increase in Name
Your Own Price® revenues discussed above. Merchant price-disclosed hotel room and car rental reservations are recorded in
merchant revenues net of the amounts paid to suppliers and therefore, there is no associated cost of revenues for merchant
price-disclosed hotel revenues. Cost of revenues as a percentage of their associated merchant revenues decreased primarily due
to the increase in merchant price-disclosed hotel revenues and the addition of rentalcars.com merchant revenue, all of which are
recorded on a "net" basis.
Agency revenues are recorded at their net amount, which are amounts received less amounts paid to suppliers, if any,
and therefore, there are no costs of agency revenues.
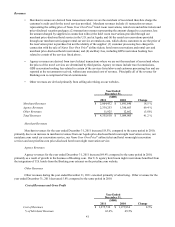
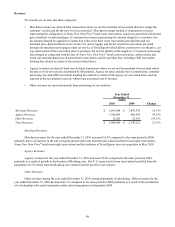
Gross Profit
Gross Profit
Gross Margin
Year Ended
December 31,
($000)
2011
$ 3,079,880
70.7%
2010
$ 1,908,971
61.9%
Change
61.3%
Total gross profit for the year ended December 31, 2011 increased by 61.3% compared to the same period in 2010,
primarily as a result of increased revenue discussed above. Total gross margin (gross profit expressed as a percentage of total
revenue) increased during the year ended December 31, 2011, compared to the same period in 2010 because Name Your Own
Price® revenues, which are recorded "gross" with a corresponding cost of revenue, represented a smaller percentage of total
revenues compared to retail, price-disclosed revenues which are primarily recorded "net" with no corresponding cost of
revenues. Because Name Your Own Price® transactions are reported "gross" and retail transactions are primarily recorded on a
"net" basis, we believe that gross profit has become an increasingly important measure of evaluating growth in our business.
Our international operations accounted for approximately $2.6 billion of our gross profit for the year ended December 31, 2011,
which compares to approximately $1.4 billion for the same period in 2010. Gross profit attributable to our international
operations increased, on a local currency basis, by approximately 70% in the year ended December 31, 2011, compared to the
same period in 2010.
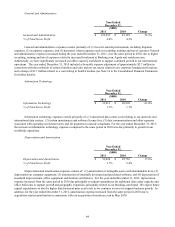
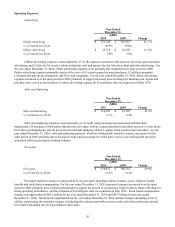
Operating Expenses
Advertising
Online Advertising
% of Total Gross Profit
Offline Advertising
% of Total Gross Profit
Year Ended
December 31,
($000)
2011
$ 919,214
29.8%
$ 35,470
1.2%
2010
$ 552,140
28.9%
$ 35,714
1.9%
Change
66.5 %
(0.7)%
Online advertising expenses primarily consist of the costs of (1) search engine keyword purchases; (2) referrals from
meta-search and travel research websites; (3) affiliate programs; (4) banner and pop-up advertisements; and (5) e-mail
campaigns. For the year ended December 31, 2011, online advertising expenses increased over the same period in 2010,
primarily to support increased hotel room night reservations for Booking.com and Agoda, increased rental car day reservations
for rentalcars.com and increased hotel room night reservations for priceline.com. Online advertising as a percentage of gross
profit increased for the year ended December 31, 2011, compared to the same period in 2010. The increase is driven primarily