Priceline 2011 Annual Report Download - page 81
Download and view the complete annual report
Please find page 81 of the 2011 Priceline annual report below. You can navigate through the pages in the report by either clicking on the pages listed below, or by using the keyword search tool below to find specific information within the annual report.
80
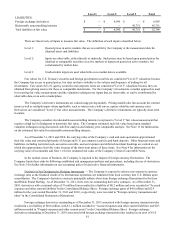
The following table summarizes, by major security type, the Company’s short-term investments as of December 31,
2010 (in thousands):
Foreign government securities
U.S. government securities
U.S. agency securities
U.S. corporate notes
Total
Cost
$ 682,841
469,116
109,920
40,845
$ 1,302,722
Gross
Unrealized
Gains
$ 558
158
15
—
$ 731
Gross
Unrealized
Losses
$(81)
(66)
(30)
(25)
$(202)
Fair Value
$ 683,318
469,208
109,905
40,820
$ 1,303,251
There were no material realized gains or losses related to investments for the years ended December 31, 2011, 2010
and 2009.
5. FAIR VALUE MEASUREMENTS
Financial assets carried at fair value as of December 31, 2011 are classified in the table below in the categories
described below (in thousands):
ASSETS:
Short-term investments:
Foreign government securities
U.S. government securities
U.S. agency securities
U.S. corporate notes
Foreign exchange derivatives
Total assets at fair value
Level 1
$ —
—
—
—
—
$ —
Level 2
$ 1,074,186
923,322
26,951
368
60,455
$ 2,085,282
Level 3
$ —
—
—
—
—
$ —
Total
$ 1,074,186
923,322
26,951
368
60,455
$ 2,085,282
LIABILITIES:
Foreign exchange derivatives
Redeemable noncontrolling interests
Total liabilities at fair value
Level 1
$ —
—
$ —
Level 2
$ 1,107
—
$ 1,107
Level 3
$ —
127,045
$ 127,045
Total
$ 1,107
127,045
$ 128,152
Financial assets and liabilities are carried at fair value as of December 31, 2010 are classified in the tables below in
the categories described below (in thousands):
ASSETS:
Short-term investments:
Foreign government securities
U.S. government securities
U.S. agency securities
U.S. corporate notes
Long-term investments
Foreign exchange derivatives
Total assets at fair value
Level 1
$ —
—
—
—
—
—
$ —
Level 2
$ 683,318
469,208
109,905
40,820
394
4,970
$ 1,308,615
Level 3
$ —
—
—
—
—
—
$ —
Total
$ 683,318
469,208
109,905
40,820
394
4,970
$ 1,308,615


