Priceline 2011 Annual Report Download - page 84
Download and view the complete annual report
Please find page 84 of the 2011 Priceline annual report below. You can navigate through the pages in the report by either clicking on the pages listed below, or by using the keyword search tool below to find specific information within the annual report.-
 1
1 -
2
-
3
-
4
-
5
-
6
-
7
-
8
-
9
-
10
-
11
-
12
-
13
-
14
-
15
-
16
-
17
-
18
-
19
-
20
-
21
-
22
-
23
-
24
-
25
-
26
-
27
-
28
-
29
-
30
-
31
-
32
-
33
-
34
-
35
-
36
-
37
-
38
-
39
-
40
-
41
-
42
-
43
-
44
-
45
-
46
-
47
-
48
-
49
-
50
-
51
-
52
-
53
-
54
-
55
-
56
-
57
-
58
-
59
-
60
-
61
-
62
-
63
-
64
-
65
-
66
-
67
-
68
-
69
-
70
-
71
-
72
-
73
-
 74
74 -
 75
75 -
 76
76 -
 77
77 -
 78
78 -
 79
79 -
 80
80 -
 81
81 -
 82
82 -
 83
83 -
 84
84 -
 85
85 -
 86
86 -
 87
87 -
 88
88 -
 89
89 -
 90
90 -
 91
91 -
 92
92 -
 93
93 -
 94
94 -
95
-
96
-
97
-
98
-
99
-
100
-
101
-
102
-
103
-
104
-
105
-
106
-
107
-
108
-
109
-
110
-
111
 |
 |

83
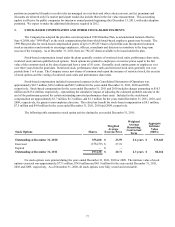
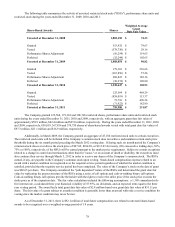
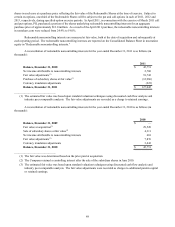
A reconciliation of the weighted average number of shares outstanding used in calculating diluted earnings per share is as
follows (in thousands):
Weighted average number of basic common shares outstanding
Weighted average dilutive stock options, restricted stock,
restricted stock units and performance share units
Assumed conversion of Convertible Senior Notes
Weighted average number of diluted common and common
equivalent shares outstanding
Anti-dilutive potential common shares
For the Year Ended December 31,
2011
49,654
828
729
51,211
1,453
2010
47,955
1,628
1,405
50,988
2,487
2009
42,406
1,336
5,780
49,522
2,843
Anti-dilutive potential common shares for the years ended December 31, 2011, 2010 and 2009 include
approximately 1.2 million, 1.9 million shares and 1.5 million shares, respectively, that could be issued under the Company’s
convertible debt if the Company experiences substantial increases in its common stock price. Under the treasury stock method,
the convertible notes will generally have a dilutive impact on net income per share if the Company’s average stock price for the
period exceeds the conversion price for the convertible notes.
The Company has Conversion Spread Hedges outstanding at December 31, 2011, which were designed to reduce
potential dilution of the Company's 0.75% Convertible Senior Notes due 2013 at their stated maturity date (see Note 11). Since
the beneficial impact of the Conversion Spread Hedges is anti-dilutive, it is excluded from the calculation of net income per
share.
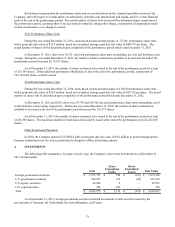
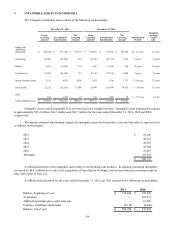
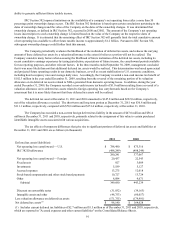
8. PROPERTY AND EQUIPMENT
Property and equipment at December 31, 2011 and 2010 consists of the following (in thousands):
Computer equipment and software
Office equipment, furniture, fixtures &leasehold improvements
Total
Less: accumulated depreciation and amortization
Property and equipment, net
2011
$ 146,926
30,031
176,957
(112,635)
$ 64,322
2010
$ 115,718
18,428
134,146
(94,407)
$ 39,739
Estimated
Useful Lives
(years)
3 to 5
3 to 10
Fixed asset depreciation and amortization expense are approximately $20.6 million, $16.2 million and $14.5 million
for the years ended December 31, 2011, 2010 and 2009, respectively.